
Forecast December 2017
December projections 2017: economic boom and expansive budget


In 2018, employment will see a substantial increase of 2% and, because of the less-rapidly growing labour supply, unemployment will decrease further, down to 3.9% of the labour force — the lowest level since 2007. The tight labour market means companies will pay higher wages, in order to attract and hold on to personnel. The increase in real wages translates into an increase in purchasing power. The jobs increase also leads to a higher disposable income for households.
This forecast is published in CPB Policy Brief 2017/13 'Decemberraming 2017' (only in Dutch).
Fan Charts December 2017
The figures present fan charts around the December 2017 point forecasts for GDP growth, HICP inflation, unemployment and general government financial balance.
The figures present fan charts around the December 2017 point forecasts for GDP growth, HICP inflation, unemployment and general government financial balance. The solid line represents data realizations (2012-2016) and the December 2017 point forecasts for 2017 and 2018. Around the central path the figures present a fan of confidence intervals:
- 30% confidence interval from the 35th to 65th percentile, dark blue area
- 60% confidence interval from the 20th to 80th percentile, dark blue + blue area
- 90% confidence interval from the 5th to 95th percentile, dark blue + blue + light blue area
The probability is thus 30% that the outcome will fall in the dark blue area and the probability is 10% that the outcome will fall outside the fan. In other words, the fan is a graphical representation of the likelihood of the various outcomes. The solid line represents the most likely outcome and outcomes are more likely when they are closer to the solid line.
Downloads

Contacts

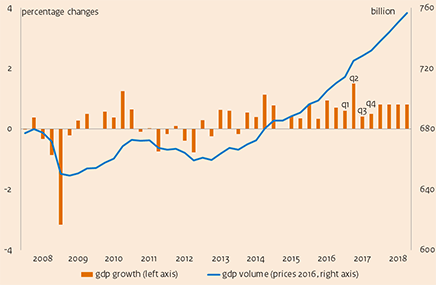
Economic growth in the Netherlands, 2008-2018
>
Downloads

Table 'Main economic indicators', 2015-2018 (a)
| 2015 | 2016 | 2017 | 2018 | |
|---|---|---|---|---|
| Relevant world trade volume goods and services (%) |
3.7 |
3.6 |
4.5 |
4.3 |
| Export price competitors (goods and services, non-commodities, %) |
8.0 |
-5.1 |
0.3 |
0.8 |
| Crude oil price (dollar per barrel) |
51.9 |
43.3 |
53.8 |
61.7 |
| Exchange rate (dollar per euro) |
1.11 |
1.11 |
1.13 |
1.17 |
| Long-term interest rate the Netherlands (level in %) |
0.7 |
0.3 |
0.5 |
0.5 |
| 2015 | 2016 | 2017 | 2018 | |
|---|---|---|---|---|
| Gross domestic product (GDP, economic growth, %) |
2.3 |
2.2 |
3.2 |
3.1 |
| Consumption households (%) |
2.0 |
1.6 |
2.2 |
2.4 |
| Consumption general government (%) |
-0.2 |
1.2 |
0.8 |
3.0 |
| Capital formation including changes in stock (%) |
11.2 |
3.1 |
5.5 |
5.5 |
| Exports of goods and services (%) |
6.5 |
4.3 |
5.7 |
4.9 |
| Imports of goods and services (%) |
8.4 |
4.1 |
5.3 |
5.5 |
| 2015 | 2016 | 2017 | 2018 | |
|---|---|---|---|---|
| Price gross domestic product (%) |
0.8 |
0.6 |
1.0 |
1.7 |
| Export price goods and services (non-energy, %) |
1.5 |
-0.9 |
1.2 |
0.8 |
| Import price goods (%) |
-5.4 |
-4.4 |
4.8 |
1.8 |
| Inflation, harmonised index of consumer prices (hicp, %) |
0.2 |
0.1 |
1.3 |
1.5 |
| Compensation per hour private sector (%) |
-0.2 |
0.6 |
1.6 |
2.9 |
| Contractual wages private sector (%) |
1.2 |
1.5 |
1.6 |
2.2 |
| Purchasing power, static, median, all households (%) |
1.0 |
2.6 |
0.3 |
0.6 |
| 2015 | 2016 | 2017 | 2018 | |
|---|---|---|---|---|
| Labour force (%) |
0.4 |
0.4 |
0.9 |
1.1 |
| Active labour force (%) |
1.0 |
1.3 |
2.1 |
2.1 |
| Unemployment (in thousands of persons) |
614 |
538 |
440 |
360 |
| Unemployed rate (% of the labour force) |
6.9 |
6.0 |
4.9 |
3.9 |
| Employment (hours, %) |
0.6 |
2.0 |
2.1 |
2.0 |
| 2015 | 2016 | 2017 | 2018 | |
|---|---|---|---|---|
| Labour share in enterprise income (level in %) |
72.2 |
72.9 |
72.4 |
72.6 |
| Labour productivity private sector (per hour, %) |
1.5 |
0.4 |
1.2 |
1.2 |
| Private savings (% of disposable household income) |
-0.4 |
0.3 |
0.0 |
0.3 |
| Current-account balance (level in % GDP) |
8.3 |
8.7 |
8.6 |
8.3 |
| 2015 | 2016 | 2017 | 2018 | |
|---|---|---|---|---|
| General government financial balance (% GDP) |
-2.1 |
0.4 |
0.5 |
0.5 |
| Gross debt general government (% GDP) |
64.6 |
61.8 |
56.6 |
53.1 |
| Taxes and social security contributions (% GDP) |
37.3 |
38.7 |
38.9 |
38.9 |
| Gross government expenditure (% GDP) |
45.2 |
43.8 |
43.0 |
42.7 |
(a) CPB uses as of MEV 2018 a new method for the calculation of the labour share in enterprise income. This new method takes better account of the income of self-employed persons and therefore better matches current economic reality. A joint 'notitie' of CBS, CPB and DNB is available on this subject (only in Dutch).