
Central Economic Plan (CEP) 2014
CPB: Slight economic recovery

Inflation for both years is projected at 1½%. This year, the government deficit will be 2.9%, and will decrease to 2.1% in 2015.
The main data in CPB’s Central Economic Plan 2014 were published two weeks ago and remain stable. Improvement in both the global and the European economy will drive economic growth in the Netherlands through an increase in export. With regard to domestic spending, investments in particular will increase, and for 2015 consumption is projected to increase for the first time in years, in line with a growth in wage income and benefits. Employment will continue to decline this year, but for 2015 labour demand is expected to improve and unemployment levels to decrease slightly, to 635,000 people. Inflation levels will remain moderate, with a percentage of 1½% projected for both this year and the next. Upward wage developments are expected to be modest due to the labour market situation. Median purchasing power this year will improve by 1¼%, as a result of lower health care and pension fund premiums, and for next year an increase of ¼% is expected.
For the first time since 2008, the government deficit will be below the Maastricht Treaty maximum budget deficit of 3%, and is projected to decrease further to 2.1% of GDP, next year.
In its Central Economic Plan 2014, CPB Netherlands Bureau for Economic Policy Analysis provides detailed information on current developments in the Dutch economy, also from an international perspective. Please note that in this report, the data revisions as announced by Statistics Netherlands (CBS) have not been taken into account.
Go directly to the Data.
Read the accompanying press release or go directly to the main indicators.
Related
- Centraal Economisch Plan 2014 (Dutch)
Downloads

Vermogensschokken en consumptie in Nederland

Deze publicatie behoort bij het Centraal Economisch Plan 2014.
Op microniveau blijkt dit effect aanwezig, afhankelijk van de mate van liquiditeitsrestricties die huishoudens ervaren. Dit is niet een op een te vertalen naar macroniveau, omdat het vermogensverlies van de ene persoon vaak de vermogenswinst van een andere persoon is. Toch zijn er verklaringen voor een macro-economisch effect. De belangrijkste zijn: (1) een verschil tussen de consumptie-elasticiteit tussen huishoudens die de voordelen van de schok ondervinden en degenen die de nadelen ondervinden; (2) verschil in het tijdstip van consumeren tussen de huidige en toekomstige vermogensbezitter; en (3) het bestaan van liquiditeitsrestricties.
Uit de empirische literatuur blijkt dat vermogensschokken wel degelijk een effect op macroniveau hebben: gemiddeld stijgt de consumptie met ongeveer vier tot vijf cent bij een vermogenstoename van één euro. Ook in het CPB-model Saffier II worden vergelijkbare effecten gebruikt voor de ramingen. Hoewel de theorie suggereert dat het effect van een vermogensschok niet voor elk vermogenstype gelijk is, is hier in de empirie niet veel bewijs voor. De gevonden effecten kennen wel een zeer grote spreiding. Ook wordt in de empirie geen eenduidig bewijs gevonden voor het bestaan van asymmetrische effecten. De theorie geeft zowel redenen voor een groter effect bij positieve, als bij negatieve schokken. Er zijn wel aanwijzingen dat de consumptiereactie op vermogensschokken groter is bij een hoge bruto schuld (lange balans) en een scheve vermogensverdeling, maar ook dit empirische bewijs is dun.
In de tweede plaats onderzoeken we de omvang van vermogens en schulden en vermogensschokken met verschillende datasets over vermogens van huishoudens, zowel in historisch als internationaal perspectief. Hieruit blijkt dat Nederlandse huishoudens veel schulden hebben, maar nog veel meer bezittingen. Vooral het huizenvermogen (met daartegenover lagere hypotheekschulden) en het pensioenvermogen zijn daar voor verantwoordelijk. Wel daalt het netto vermogen (exclusief pensioenen) de laatste jaren, vooral onder invloed van de huizenprijsdalingen. Dit vermogen is in vijf jaar tijd ongeveer tien procent gedaald door vermogensschokken; ongeveer 200 mld euro. De schulden blijven wel oplopen, waardoor de verhouding tussen schulden en bezittingen verslechtert. Ook in vergelijking met onze buurlanden en met het eurogebied is de situatie in Nederland opvallend, omdat Nederlandse huishoudens een lange balans hebben: ze hebben zowel veel bezittingen als veel schulden. De schulden stijgen veel harder dan in andere eurolanden, terwijl de bezittingen zich op een vergelijkbare manier ontwikkelen. Dit uit zich in een relatief slecht ontwikkelend netto vermogen.
Het vermogen van Nederlandse huishoudens is met een gini-coëfficiënt van ongeveer 0,8 veel schever verdeeld dan inkomen. Het is niet duidelijk of dit in internationaal perspectief hoog is, omdat er hierover weinig vergelijkbare data beschikbaar zijn. Uit studies die wel een poging wagen komt een wisselend beeld naar voren. De scheefheid verandert nauwelijks over de tijd. Wel is het aantal huishoudens met een negatief vermogen (exclusief pensioenvermogen) de laatste jaren verdubbeld. Dit betreft vooral huizenbezitters.
Door het hoge niveau van bezittingen en schulden is de Nederlandse economie kwetsbaar voor vermogensschokken. Er zijn echter weinig aanwijzingen dat deze consumptiereactie nu sterker is dan in tijden van een waardestijging van het vermogen. Op de onderzoeksagenda van het CPB voor 2014 staan enkele projecten die hierover meer duidelijkheid moeten gaan geven, ook in relatie tot de ramingen voor de Nederlandse economie die het CPB periodiek publiceert en het model Saffier II dat het daarvoor gebruikt.
Authors

Presentatie Centraal Economisch Plan 2014
Lees ook het persbericht behorend bij het Centraal Economisch Plan 2014.
Authors
CPBs short-term forecasts March 2014
- Main Conclusions
- The table 'Main economic indicators', 2012-2015
- Graph 'Economic growth in the Netherlands, 2008-2015'
- Related Publication
- Appendix: Main Economic Indicators for the Netherlands, 1970-2015
- Appendix: Main indicators labour market (E5), 1969-2015
Main conclusions
Read the accompanying press release.
Table 'Main economic indicators', 2012-2015 (CEP 2014, 18 March 2014)
| 2012 | 2013 | 2014 | 2015 | |
|---|---|---|---|---|
| Relevant world trade volume (%) |
0.7 |
1.9 |
4 1/4 |
5 |
| Export price competitors (%) |
4.1 |
-1.6 |
-1 |
1/2 |
| Crude oil price (Brent, level in dollars per barrel) |
111.7 |
108.7 |
108 |
108 |
| Exchange rate (dollar per euro) |
1.28 |
1.33 |
1.36 |
1.36 |
| Long-term interest rate the Netherlands (level in %) |
1.9 |
2.0 |
2.3 |
2.6 |
| 2012 | 2013 | 2014 | 2015 | |
|---|---|---|---|---|
| Gross domestic product (GDP, economic growth, %) |
-1.2 |
-0.8 |
3/4 |
1 1/4 |
| Consumption households (%) |
-1.6 |
-2.1 |
-1/4 |
1/2 |
| Consumption general government (%) |
-0.7 |
-0.5 |
1/2 |
-1/4 |
| Capital formation including changes in stock (%) |
-2.7 |
-7.1 |
4 3/4 |
3 1/4 |
| Exports of goods and services (%) |
3.2 |
1.3 |
2 1/4 |
4 1/4 |
| Imports of goods and services (%) |
3.3 |
-0.5 |
2 1/2 |
4 |
| 2012 | 2013 | 2014 | 2015 | |
|---|---|---|---|---|
| Price gross domestic product (%) |
1.3 |
1.8 |
3/4 |
1 1/4 |
| Export price domestically produced goods (non energy, %) |
1.7 |
0.8 |
-1/2 |
1/2 |
| Import price goods (%) |
2.7 |
-1.7 |
-1 1/4 |
3/4 |
| National consumer price index (CPI, %) |
2.5 |
2.5 |
1 1/2 |
1 1/2 |
| Contractual wages market sector (%) |
1.6 |
1.5 |
1 1/2 |
2 |
| Purchasing power, static, median all households (%) |
-2.3 |
-1.1 |
1 1/4 |
1/4 |
| 2012 | 2013 | 2014 | 2015 | |
|---|---|---|---|---|
| Labour force (%) |
1.5 |
0.8 |
-1/4 |
1/4 |
| Active labour force (%) |
0.6 |
-0.7 |
-1 |
1/2 |
| Unemployment (in thousands of persons) |
469 |
602 |
650 |
635 |
| Unemployed rate (% of the labour force) |
5.3 |
6.7 |
7 1/4 |
7 |
| 2012 | 2013 | 2014 | 2015 | |
|---|---|---|---|---|
| Production (%) |
-1.9 |
-1.5 |
1 3/4 |
2 |
| Labour productivity (labour years, %) |
-1.7 |
-0.5 |
2 |
1 1/4 |
| Employment (labour years, %) |
-0.2 |
-1.1 |
-1/4 |
3/4 |
| Compensation per employee (%) |
1.7 |
2.2 |
3 1/2 |
1 3/4 |
| Labour share in enterprise income (level in %) |
80.5 |
81.1 |
81 1/2 |
80 1/2 |
| 2012 | 2013 | 2014 | 2015 | |
|---|---|---|---|---|
| Private savings (% of disposable household income) |
-2.0 |
-2.1 |
-1 |
-1/2 |
| Current-account balance (level in % GDP) |
7.7 |
9.7 |
9 1/2 |
9 3/4 |
| 2012 | 2013 | 2014 | 2015 | |
|---|---|---|---|---|
| General government financial balance (% GDP) |
-4.1 |
-2.9 |
-2.9 |
-2.1 |
| Gross debt general government (% GDP) |
71.3 |
74.3 |
74.6 |
74.7 |
| Taxes and social security contributions (% GDP) |
39.0 |
39.6 |
40.7 |
41.3 |
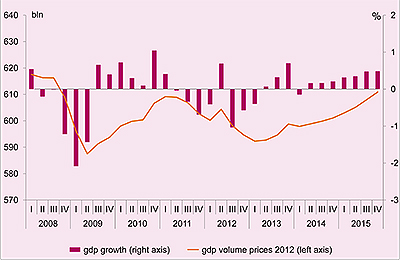
Economic growth in the Netherlands, 2008-2015
Related publication
The revision of the National Accounts as previously announced by Statistics Netherlands has not been incorporated in this forecast. This will not be done until next September in the Macro Economic Outlook 2015.
Downloads
