
Macro Economic Outlook (MEV) 2017
Post-crisis recovery continues, uncertainty remains
Steady, post-crisis recovery is projected to continue over the 2018–2021 period, both internationally and in the Netherlands. The global economy will grow by an average of 4%, annually, and for the Netherlands this will be 1.7%. Unemployment will decrease slightly, to 5.5% by 2021. The government budget is projected to go from a deficit of 0.7% GDP in 2017 to a surplus of 0.9% of GDP in 2021. The budget will prove sustainable in the long term, as is concluded in the Macro Economic Outlook (MEV), published today by CPB Netherlands Bureau for Economic Policy Analysis.
Purchasing power
Median purchasing power is projected to improve by 1.0%, next year. Those employed will experience a 1.1% improvement, as will benefit recipients, while for pensioners this will be 0.7%. These figures also include the Cabinet’s policy measures for 2017.
Median static purchasing power is not expected to increase over the 2018–2021 period. For the employed, it will remain stable, while benefit recipients and pensioners will see a decrease.
Inflation
In line with economic recovery and supported by increasing oil prices, inflation in the eurozone will increase. For the Netherlands, medium-term inflation is projected to remain low, with an average 1.2%, similar to that in the rest of the eurozone, and far below the ECB’s objective.
Labour market flexibility – analysis
CPB’s analysis in this year’s MEV report concerns labour market flexibility. In the Netherlands, the number of people with a flexible labour contract and independent professionals are increasing; both are now on a higher level than in other countries. Whether this is a negative thing is debatable. Preferences of the employed offer no plausible explanation for this increase in flexibility in the Netherlands, nor do general trends – such as in globalisation and technological developments. After all, surrounding countries are also affected by such trends. Figures show that the high level of flexibility is also not a temporary phenomenon, or the result of an unfavourable economic situation. This appears to leave policy as the determining factor, which is also where the key to chance will be found.
Read the complete publication in Dutch.
Related:
Short-term forecasts September 2016
Macro Economic Outlook 2017 (MEV 2017, only in Dutch), ISBN 978-90-1239-863-3 can be ordered at: Webshop Sdu.
Downloads
 2017")
Lees ook de Macro Economische Verkenning 2017.
De belangrijkste norm is dat Nederland het feitelijke overheidstekort beneden de 3% bbp houdt. Nederland zou weer met een buitensporigtekortprocedure te maken kunnen krijgen als blijkt dat het feitelijke overheidstekort in het afgelopen jaar meer dan 3% bbp bedroeg, of als het geraamde tekort meer dan 3% bbp is. In alle ramingsjaren blijft het tekort minder dan 3% bbp. Als aan de 3%-norm is voldaan, wordt getoetst op begrotingsevenwicht. Voor Nederland dient het structurele EMU-saldo uiteindelijk minimaal gelijk te zijn aan zijn middellangetermijndoelstelling van het EMU-saldo (MTO): -0,5% bbp. In 2015 en de twee ramingsjaren is het saldo negatiever dan de MTO. De begroting is daarmee niet in evenwicht.
Authors
De tabel bevat de actuele raming van de mediane cumulatieve koopkrachtontwikkeling (in procenten) voor 2014-2017 naar inkomenshoogte en naar inkomensbron. Zoals te doen gebruikelijk wordt hierbij uitgegaan van de statische koopkrachtdefinitie.
Authors
Lees ook de Macro Economische Verkenning 2017.
Voor de bekostiging van uitkeringen op grond van de Participatiewet ontvangen gemeenten vrij besteedbaar budget. De hoogte van het budget wordt bepaald op basis van een raming voor het aantal uitkeringsgerechtigden en de gemiddelde hoogte van een uitkering. Het CPB publiceert ramingen van het aantal bijstandsuitkeringen in het lopende en komende jaar in het Centraal Economisch Plan (CEP) in maart en in de Macro Economische Verkenning (MEV) in september. Het uitgangspunt in de raming is de ramingsregel die het verband weergeeft tussen mutaties in de werkloze beroepsbevolking (WBB) en de mutatie in de bijstand.
Authors
Lees ook de Macro Economische Verkenning 2017.
Op basis van de huidige beleidsvoornemens bedragen in de jaren 2011 tot en met 2017 de tekortreducerende maatregelen gemiddeld 7 mld euro per jaar (circa 1% bbp per jaar). Cumulatief komt dit neer op 46 mld euro (44 mld euro exclusief het tijdelijke EMU-relevante effect van de uitfasering van pensioen in eigen beheer). Deze tekortreducerende maatregelen vloeien niet alleen voort uit het Regeerakkoord van het kabinet Rutte-Asscher maar ook uit het 6-miljard-pakket, het Begrotingsakkoord 2013 (Lente-akkoord) en het Regeer- en Gedoogakkoord van het kabinet Rutte-Verhagen uit 2010. Het lastenverlichtingspakket in de begroting 2016 (5-miljard-pakket) en de aanvullende maatregelen voor de ontwerpbegroting 2017 verminderen het totaal van de tekortreducerende maatregelen.
Authors
Main conclusions
Read the accompanying press release and the Macro Economic Outlook 2017.
Fan Charts
Take a look at the Fan Charts.
Economic growth in the Netherlands, 2008-2017
>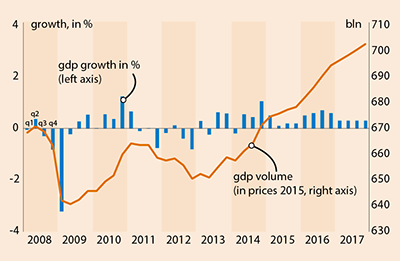
Table 'Main economic indicators', 2014-2017
| 2014 | 2015 | 2016 | 2017 | |
|---|---|---|---|---|
| Relevant world trade volume goods and services (%) |
3.9 |
3.8 |
3.4 |
3.2 |
| Export price competitors (goods and services, non-commodities, %) |
-1.3 |
6.0 |
-2.2 |
1.2 |
| Crude oil price (dollar per barrel) |
99.0 |
52.5 |
43.7 |
51.4 |
| Exchange rate (dollar per euro) |
1.33 |
1.11 |
1.11 |
1.11 |
| Long-term interest rate the Netherlands (level in %) |
1.5 |
0.7 |
0.2 |
0.1 |
| 2014 | 2015 | 2016 | 2017 | |
|---|---|---|---|---|
| Gross domestic product (GDP, economic growth, %) |
1.4 |
2.0 |
1.7 |
1.7 |
| Consumption households (%) |
0.3 |
1.8 |
1.3 |
1.8 |
| Consumption general government (%) |
0.3 |
0.2 |
0.8 |
1.0 |
| Capital formation including changes in stock (%) |
3.2 |
6.2 |
5.0 |
3.8 |
| Exports of goods and services (%) |
4.5 |
5.0 |
3.2 |
3.1 |
| Imports of goods and services (%) |
4.2 |
5.8 |
3.7 |
3.8 |
| 2014 | 2015 | 2016 | 2017 | |
|---|---|---|---|---|
| Price gross domestic product (%) |
0.1 |
0.1 |
0.5 |
0.9 |
| Export price goods and services (non-energy, %) |
-1.0 |
0.2 |
-1.5 |
0.9 |
| Import price goods (%) |
-2.7 |
-5.1 |
-3.7 |
2.1 |
| Inflation, harmonised index of consumer prices (hicp, %) |
0.3 |
0.2 |
0.0 |
0.5 |
| Contractual wages market sector (%) |
1.0 |
1.3 |
1.6 |
1.6 |
| Purchasing power, static, median, all households (%) |
1.3 |
1.1 |
2.8 |
1.0 |
| 2014 | 2015 | 2016 | 2017 | |
|---|---|---|---|---|
| Labour force (%) |
-0.4 |
0.4 |
0.3 |
0.7 |
| Active labour force (%) |
-0.6 |
1.0 |
1.0 |
0.8 |
| Unemployment (in thousands of persons) |
660 |
614 |
555 |
555 |
| Unemployed rate (% of the labour force) |
7.4 |
6.9 |
6.2 |
6.2 |
| 2014 | 2015 | 2016 | 2017 | |
|---|---|---|---|---|
| Production (%) |
2.4 |
2.8 |
2.2 |
2.3 |
| Labour productivity (hours, %) |
1.6 |
1.6 |
0.6 |
1.4 |
| Employment (hours, %) |
0.8 |
1.2 |
1.6 |
0.9 |
| Compensation per hour (%) |
0.8 |
0.2 |
2.3 |
2.0 |
| Labour share in enterprise income (level in %) |
78.7 |
77.1 |
78.1 |
78.1 |
| 2014 | 2015 | 2016 | 2017 | |
|---|---|---|---|---|
| Private savings (% of disposable household income) |
-1.4 |
0.2 |
2.2 |
1.7 |
| Current-account balance (level in % GDP) |
8.5 |
8.5 |
8.7 |
8.2 |
| 2014 | 2015 | 2016 | 2017 | |
|---|---|---|---|---|
| General government financial balance (% GDP) |
-2.3 |
-1.9 |
-1.1 |
-0.7 |
| Gross debt general government (% GDP) |
67.9 |
65.1 |
63.3 |
61.8 |
| Taxes and social security contributions (% GDP) |
37.5 |
37.7 |
38.2 |
38.7 |
CPB uses as of CEP 2016 hours worked instead of FTE as standard for labour input. This has implications for the figures on wage rates and employment. A CPB Background Document with more information is available (only in Dutch).
Downloads
