
December 13, 2011
CPBs short-term forecasts December 2011: The Netherlands in a recession
The Dutch economy is in recession. In 2012, GDP is expected to decline by ½ percent, while the unemployment level increases by 90.000 persons, to 5¼ percent of the labour force. The budget deficit goes down to 4.1% in 2012, which is less than previously expected due to the worsened economic prospects.

- Main Conclusions
- The table 'Extended main economic indicators'
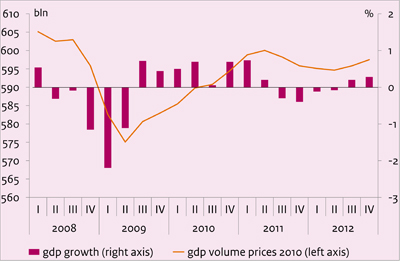
- Graph 'Economic growth in the Netherlands, 2008-2012'
- Related Publication
- Appendix : Main Economic Indicators for the Netherlands, 1970-2012
- Appendix : Key data for the world economy and external data for the Netherlands, 1975-2012
Main conclusions
Read the accompanying press release.
The table 'Extended main economic indicators'
| 2009 | 2010 | 2011 | 2012 | |
|---|---|---|---|---|
| Relevant world trade (vol. %) | -13.4 | 11.1 | 3 3/4 | -3/4 |
| Import price goods (%) | -7.3 | 7.3 | 5 | 1 3/4 |
| Export price competitors (%) | -4.8 | 7.7 | 5 1/2 | 0 |
| Crude oil price (Brent, $) | 61.5 | 79.5 | 112 | 112 |
| Exchange rate (dollar p euro) | 1.39 | 1.33 | 1.40 | 1.38 |
| Long-term interest rate (level in %) | 3.7 | 3.0 | 2.9 | 2.7 |
| 2009 | 2010 | 2011 | 2012 | |
|---|---|---|---|---|
| Gross domestic product (GDP, economic growth) (%) | -3.5 | 1.7 | 1 1/2 | -1/2 |
| Value gross domestic product (GDP) (bln euro) | 571.1 | 588.4 | 604 | 613 |
| Private consumption (%) | -2.6 | 0.4 | -3/4 | -1/2 |
| Public demand (%) | 4.8 | 0.7 | 0 | -1 |
| Gross fixed investment, private non-residential (%) | -12.4 | -1.4 | 6 1/4 | -6 |
| Exports of goods (non-energy) (%) | -9.3 | 12.8 | 5 1/4 | -1/2 |
| of which domestically produced (%) | -10.5 | 9.4 | 2 1/2 | -1 1/4 |
| re-exports (%) | -8.2 | 15.8 | 7 1/2 | 0 |
| Imports of goods (%) | -9.7 | 12.6 | 3 1/2 | -1 1/2 |
| 2009 | 2010 | 2011 | 2012 | |
|---|---|---|---|---|
| Export price goods (excluding energy) (%) | -5.2 | 4.4 | 1 | 1/4 |
| Price competitiveness (%) | 1.9 | 1.8 | 1 | 1/2 |
| Consumer prices (CPI) (%) | 1.2 | 1.3 | 2 1/4 | 2 |
| Consumer prices (harmonised, HICP) (%) | 1.0 | 0.9 | 2 1/2 | 2 |
| Price of gross domestic product (%) | -0.4 | 1.3 | 1 1/4 | 1 3/4 |
| Price of national expenditure (%) | 0.7 | 1.4 | 1 1/4 | 2 1/2 |
| Contractual wages market sector (%) | 2.7 | 1.0 | 1 1/2 | 1 3/4 |
| Compensation per full-time employee market sector (%) | 2.2 | 1.5 | 2 1/2 | 3 1/4 |
| Gross wage Jones family (in euro's) | 32500 | 32500 | 33000 | 33000 |
| Purchasing power (Jones, one-income household) (%) | 1.8 | -1.3 | -1 1/2 | -2 |
| Purchasing power, static, (median, all households) (%) | 1.7 | -0.5 | -1 | -1 1/4 |
| 2009 | 2010 | 2011 | 2012 | |
|---|---|---|---|---|
| Population (x 1000 pers.) | 16530 | 16615 | 16690 | 16765 |
| Labour force (15-74) (x 1000 pers.) | 8772 | 8748 | 8735 | 8815 |
| Employed labour force (15-74) (x 1000 pers.) | 8445 | 8358 | 8345 | 8340 |
| Unemployment (x 1000 pers.) | 327 | 390 | 385 | 475 |
| Employed Persons (15-74) (%) | -0.7 | -0.3 | 1/4 | -1/2 |
| Labour force (15-74) (%) | 0.7 | -0.3 | -1/4 | 1 |
| Employed labour force (15-74) (%) | 0.1 | -1.0 | -1/4 | 0 |
| Unemployment rate (% labour force) | 3.7 | 4.5 | 4 1/2 | 5 1/4 |
| Idem, national definition (% labour force) | 4.8 | 5.4 | 5 1/2 | 6 1/2 |
| 2009 | 2010 | 2011 | 2012 | |
|---|---|---|---|---|
| Production (%) | -5.1 | 1.3 | 2 | -3/4 |
| Labour productivity (%) | -3.0 | 3.0 | 2 | 1/2 |
| Employment (labour years) (%) | -2.2 | -1.6 | 0 | -1 |
| Price gross value added (%) | 2.5 | 2.2 | 1/4 | 1 1/4 |
| Real labour costs (%) | -0.3 | -0.6 | 2 1/4 | 2 1/4 |
| Labour share in enterprise income (level in %) | 81.1 | 78.7 | 78 1/4 | 79 3/4 |
| Profit share (of domestic production) (level in %) | 7.5 | 7.7 | 9 1/2 | 7 1/2 |
| 2009 | 2010 | 2011 | 2012 | |
|---|---|---|---|---|
| General government financial balance (% GDP) | -5.6 | -5.1 | -4.6 | -4.1 |
| Gross debt general government (% GDP) | 60.8 | 62.9 | 65.2 | 68.2 |
| Taxes and social security contributions (% GDP) | 38.3 | 38.8 | 38.3 | 38.9 |
Economic growth in the Netherlands, 2008-2012
Related publication
Downloads
English, Excel, 61 KB
English, Excel, 70 KB
Contacts
