CPBs short-term forecasts June 2012: economic growth on a low level until 2017
Short-term forecasts June 2012: Low economic growth up to 2017
Take a look at the Table Extended Main Economic Indicators.
The growth of the Gross Domestic Product (GDP) per person (2010-2017) is lower than the recovery rate in many other countries after previous financial crises. The main cause is lagging domestic consumption, depressed by the decreased prices of homes, combined with the pension fund problems and the consequences of the ‘Spring Accord’, the 2013 Budget Accord of five political parties in the Lower House of Parliament. CPB Netherlands Bureau for Economic Policy Analysis stated this in its 2012 June Forecast published today, including an economic outlook 2013-2017 and the calculation of the effects of the 2013 Budget Accord.
The Euro crisis remains the dark cloud above both the European and the Dutch economy. If the crisis should escalate, growth will remain lower than forecast, which will cause severe losses in the Netherlands. The core assumption of the forecast is that escalation of the crisis will be prevented, but that confidence will not be restored to any substantial degree in the short term. However, preventing escalation will require a major effort of both the governments and the central banks, in which the Dutch contribution is a significant factor. Steps leading to a European banking union are currently the best opportunity in preventing escalation.
Hesitant recovery of the Dutch economy after 2012 is coupled with a moderate annual growth of employment by one quarter percent during the period 2013-2017. Unemployment will peak at 6¼ percent during 2014, decreasing to 470,000 people ((5¼ percent of the labour population) by 2017 - the same rate expected for this year. Average median purchasing power will remain unchanged during this period. Government finance will remain a concern. In 2017, the budget deficit (EMU balance) is estimated at 2.6 percent, with national debt reaching 74.1 percent of GDP.
The budget deficit will amount to 2.9 percent GDP in 2013. This improvement in the EMU balance is mainly the result of raised taxes resultant from the 2013 Budget Accord. After a decrease in purchasing power during both 2010 and 2011, it will continue to decrease during both 2012 and 2013.This is longer than previously foreseen, due to higher inflation and frozen government wages. During 2013, purchasing power will decrease by ¾ percent. The national debt will reach a level of 72.9 percent of GDP and will continue to increase until 2016. National debt will not start decreasing until 2017, for the first time since the 2007/2008 crisis started. The sustainability of government finance has strongly improved due to the Budget Accord (1.8 percent GDP), in particular by gradually raising the state pension eligibility age and by adjustments to the mortgage interest tax facility. The sustainability gap currently amounts to 8 billion Euros, or 1.1% GDP.
Figures up to 2017 are published in CPB Policy Brief 2012/01 'Juniraming 2012' (only in Dutch).
- Main Conclusions
- The table 'Extended main economic indicators', 2010-2013
- Graph 'Economic growth in the Netherlands, 2008-2013'
- Related Publication
- Appendix: Main Economic Indicators for the Netherlands, 1970-2013
- Appendix: Key data for the world economy and external data for the Netherlands, 1970-2013
Main conclusions
Read the accompanying press release.
Table 'Extended main economic indicators', 2010-2013
| 2010 | 2011 | 2012 | 2013 | |
|---|---|---|---|---|
| Relevant world trade (vol. %) | 11.3 | 4.0 | 1 1/4 | 4 1/2 |
| Import price goods (%) | 7.3 | 5.1 | 3 1/4 | 1 1/4 |
| Export price competitors (%) | 7.9 | 6.3 | 2 1/2 | 1 1/2 |
| Crude oil price (Brent, $) | 79.5 | 111.3 | 120 | 120 |
| Exchange rate (dollar p euro) | 1.33 | 1.39 | 1.31 | 1.32 |
| Long-term interest rate (level in %) | 3.0 | 2.9 | 2.1 | 2.5 |
| 2010 | 2011 | 2012 | 2013 | |
|---|---|---|---|---|
| Gross domestic product (GDP, economic growth) (%) | 1.7 | 1.3 | -3/4 | 3/4 |
| Value gross domestic product (GDP) (bln euro) | 588.4 | 602.4 | 606 | 623 |
| Private consumption (%) | 0.4 | -1.1 | -1/2 | -1/4 |
| Public demand (%) | 0.7 | 0.4 | -1 | -3/4 |
| Gross fixed investment, private non-residential (%) | -1.4 | 7.5 | -3 3/4 | 3 1/4 |
| Exports of goods (non-energy) (%) | 12.8 | 3.9 | 3 | 3 3/4 |
| of which domestically produced (%) | 9.4 | 1.5 | 1 3/4 | 3 3/4 |
| re-exports (%) | 15.8 | 5.9 | 4 | 4 |
| Imports of goods (%) | 12.6 | 4.0 | 3 3/4 | 2 1/4 |
| 2010 | 2011 | 2012 | 2013 | |
|---|---|---|---|---|
| Export price goods (excluding energy) (%) | 4.4 | 1.5 | 1/4 | 1 1/4 |
| Price competitiveness (%) | 1.9 | 2.5 | 2 1/4 | 1/2 |
| Consumer prices (CPI) (%) | 1.3 | 2.3 | 2 1/2 | 2 |
| Consumer prices (harmonised, HICP) (%) | 0.9 | 2.5 | 3 | 1 3/4 |
| Price of gross domestic product (%) | 1.3 | 1.1 | 1 1/2 | 2 |
| Price of national expenditure (%) | 1.4 | 0.9 | 2 1/4 | 2 |
| Contractual wages market sector (%) | 1.0 | 1.4 | 1 3/4 | 2 1/4 |
| Compensation per full-time employee market sector (%) | 1.5 | 2.5 | 3 1/4 | 2 3/4 |
| Gross wage Jones family (in euro's) | 32500 | 33000 | 33000 | 33000 |
| Purchasing power (Jones, one-income household) (%) | -1.3 | -1.4 | -2 1/2 | -1/2 |
| Purchasing power (median, all households) (%) | -0.6 | -1.0 | -2 | -3/4 |
| 2010 | 2011 | 2012 | 2013 | |
|---|---|---|---|---|
| Population (x 1000 pers.) | 16615 | 16691 | 16765 | 16830 |
| Labour force (15-74) (x 1000 pers.) | 8748 | 8744 | 8865 | 8905 |
| Employed labour force (15-74) (x 1000 pers.) | 8358 | 8357 | 8395 | 8370 |
| Unemployment (x 1000 pers.) | 390 | 387 | 470 | 535 |
| Employed Persons (15-74) (%) | -0.3 | 0.3 | -1/4 | -1/4 |
| Labour force (15-74) (%) | -0.3 | 0.0 | 1 1/4 | 1/2 |
| Employed labour force (15-74) (%) | -1.0 | 0.0 | 1/2 | -1/4 |
| Unemployment rate (% labour force) | 4.5 | 4.4 | 5 1/4 | 6 |
| Idem, national definition (% labour force) | 5.4 | 5.4 | 6 1/4 | 7 |
| 2010 | 2011 | 2012 | 2013 | |
|---|---|---|---|---|
| Production (%) | 1.3 | 2.0 | -1 1/2 | 1 1/4 |
| Labour productivity (%) | 3.0 | 1.9 | -1 | 2 1/4 |
| Employment (labour years) (%) | -1.6 | 0.1 | -1/2 | -1 |
| Price gross value added (%) | 2.2 | 0.1 | 1/4 | 1/2 |
| Real labour costs (%) | -0.6 | 2.5 | 2 3/4 | 2 |
| Labour share in enterprise income (level in %) | 78.7 | 78.6 | 82 1/4 | 81 3/4 |
| 2010 | 2011 | 2012 | 2013 | |
|---|---|---|---|---|
| General government financial balance (% GDP) | -5.1 | -4.7 | -3.8 | -2.9 |
| Gross debt general government (% GDP) | 62.9 | 65.2 | 71.7 | 72.9 |
| Taxes and social security contributions (% GDP) | 38.8 | 38.3 | 39.0 | 39.9 |
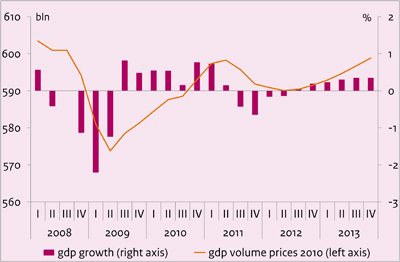
Economic growth in the Netherlands, 2008-2013