
September 21, 2010
CPBs short-term forecasts September 2010: Hesitant recovery
Four times a year CPB publishes short-term forecasts of the Dutch economy and the world economy. This is the third forecast of 2010, CPB's Macro Economic Outlook 2011. With this publication, CPB Netherlands Bureau for Economic Policy Analysis presents its analyses and forecasts of both the Dutch and worldwide economy in the years 2010 and 2011.
- Main Conclusions
- The table 'Extended main economic indicators'
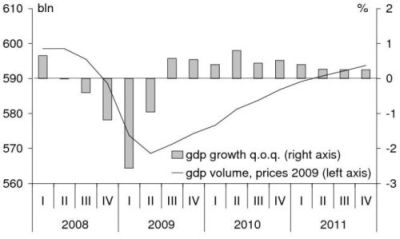
- Graph 'Economic growth in the Netherlands, 2008-2011'
- Related Publications
- Appendix: Main Economic Indicators for the Netherlands, 1970-2011
Main conclusions of CPB’s short-term forecasts September 2010
- The Dutch economy is expected to grow by 1¾% in 2010. Next year, GDP growth decelerates somewhat, to 1½%.
- The estimated average unemployment rate rises to 5½% of the labour force in 2010 and remains at that level next year.
- Inflation is expected to rise to 1¼% in 2010 and 1½% in 2011. Contractual wage growth in the market sector will come out at 1% and 1½% respectively.
- Purchasing power of households (median) declines by ½% this year and by ¼% next year.
- The government budget deficit will be 5.8% GDP this year. The deficit will decrease to 3.9% GDP in 2011.
Read here the accompanying press release.
The table 'Extended main economic indicators'
| 2008 | 2009 | 2010 | 2011 | |
|---|---|---|---|---|
| Relevant world trade volume (%) |
1,6 |
-12,6 |
9 |
5 1/4 |
| Import price goods (%) |
4,6 |
-7,5 |
6 3/4 |
3/4 |
| Export price competitors (%) |
3,9 |
-3,0 |
4 |
3/4 |
| Crude oil price (Brent, $) |
96,9 |
61,5 |
76 |
75 |
| Exchange rate (dollar per euro) |
1,47 |
1,39 |
1,29 |
1,25 |
| Long-term interest rate (%) |
4,3 |
3,7 |
3 1/4 |
3 3/4 |
| 2008 | 2009 | 2010 | 2011 | |
|---|---|---|---|---|
| Gross domestic product (GDP, economic growth) (%) |
1,9 |
-3,9 |
1 3/4 |
1 1/2 |
| Private consumption (%) |
1,1 |
-2,5 |
1/2 |
3/4 |
| Public demand (%) |
3,0 |
4,0 |
1/2 |
-1/4 |
| Gross fixed investment, private non-residential (%) |
7,1 |
-18,2 |
-5 1/2 |
-2 3/4 |
| Exports of goods (non-energy) (%) |
1,2 |
-9,2 |
12 3/4 |
7 1/2 |
| of which domestically produced (%) |
-1,4 |
-10,5 |
8 1/4 |
3 |
| re-exports (%) |
3,8 |
-7,9 |
16 3/4 |
11 1/4 |
| Imports of goods (%) |
3,3 |
-10,3 |
11 1/4 |
6 |
| Value gross domestic product (GDP) (bln euro) |
596,2 |
572,0 |
593 |
615 |
| 2008 | 2009 | 2010 | 2011 | |
|---|---|---|---|---|
| Export price goods (excluding energy) (%) |
2,1 |
-5,3 |
4 3/4 |
3/4 |
| Price competitiveness (%) |
-0,1 |
4,2 |
-2 |
1/4 |
| Consumer prices (CPI) (%) |
2,5 |
1,2 |
1 1/4 |
1 1/2 |
| Consumer prices (harmonised, HICP) (%) |
2,2 |
0,9 |
1 |
1 1/2 |
| Price of gross domestic product (%) |
2,4 |
-0,2 |
2 |
2 |
| Price of national expenditure (%) |
2,1 |
0,9 |
1 1/2 |
1 3/4 |
| Contractual wages market sector (%) |
3,5 |
2,7 |
1 |
1 1/2 |
| Compensation per full-time employee market sector (%) |
3,5 |
2,0 |
2 |
3 |
| Gross wage Jones family (in euro's) |
31500 |
32500 |
32500 |
33000 |
| Purchasing power (Jones, one-income household) (%) |
-0,6 |
1,9 |
-1 1/4 |
-1/4 |
| Purchasing power (median, all households) (%) |
0,0 |
1,8 |
-1/2 |
-1/4 |
| 2008 | 2009 | 2010 | 2011 | |
|---|---|---|---|---|
| Population (x 1000 pers.) |
16446 |
16532 |
16605 |
16660 |
| Labour force (15-64) (x 1000 pers.) |
7801 |
7846 |
7805 |
7790 |
| Employed labour force (15-64) (x 1000 pers.) |
7501 |
7469 |
7370 |
7350 |
| Unemployment (x 1000 pers.) |
300 |
377 |
435 |
435 |
| Labour force (15-64) (%) |
1,9 |
0,6 |
-1/2 |
-1/4 |
| Employed labour force (15-64) (%) |
2,6 |
-0,4 |
-1 1/4 |
-1/4 |
| Unemployment rate (%) |
3,8 |
4,8 |
5 1/2 |
5 1/2 |
| Idem, international definition (%) |
2,8 |
3,4 |
4 1/4 |
4 1/4 |
| 2008 | 2009 | 2010 | 2011 | |
|---|---|---|---|---|
| Production (%) |
1,7 |
-5,4 |
1 3/4 |
2 |
| Labour productivity (%) |
0,5 |
-3,1 |
4 1/4 |
2 1/4 |
| Employment (labour years) (%) |
1,2 |
-2,4 |
-2 1/4 |
-1/4 |
| Price gross value added (%) |
0,7 |
2,6 |
2 1/4 |
1 |
| Real labour costs (%) |
2,8 |
-0,6 |
0 |
2 |
| Labour share in enterprise income (level in %) |
79,0 |
80,9 |
77 1/4 |
76 3/4 |
| Profit share (of domestic production) (level in %) |
13,8 |
7,7 |
11 3/4 |
13 1/2 |
| 2008 | 2009 | 2010 | 2011 | |
|---|---|---|---|---|
| General government financial balance (% GDP) |
0,6 |
-5,4 |
-5,8 |
-3,9 |
| Gross debt general government (% GDP) |
58,2 |
60,8 |
64,5 |
66,2 |
| Taxes and social security contributions (% GDP) |
39,1 |
38,2 |
37,9 |
38,5 |
Economic growth in the Netherlands, 2008-2011
Related publications
Downloads
English, Excel, 44 KB