Forecast September 2019 (MEV 2020)
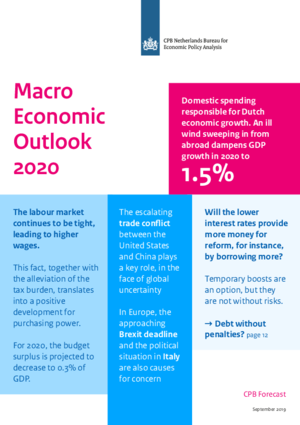
Ill winds sweeping in from abroad will dampen growth in 2020
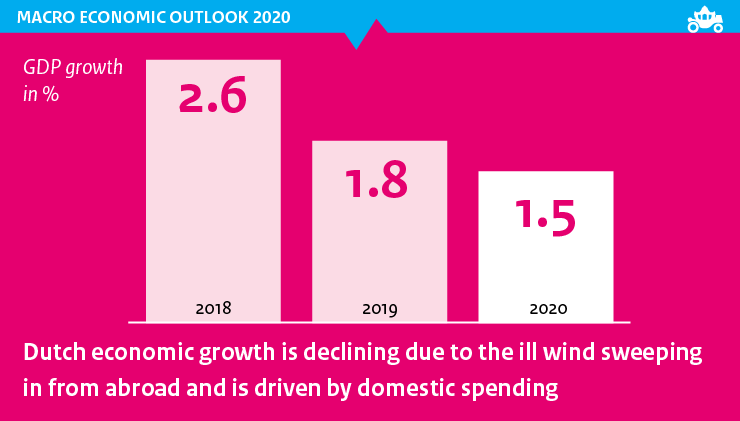
Economic growth and the increase in purchasing power are higher than according to CPB’s concept projections (cMEV) published in August. This is due to the fact that now the Dutch Cabinet’s decisions have been taken into account. The projected economic growth for 2020 has been adjusted upwards by 0.1 percentage point and, because of the additional tax cuts, the increase in purchasing power has been adjusted upwards, on average, by 0.9 percentage points.
The analysis in this Macro Economic Outlook examines what the currently low interest rates mean for the budget policy. Laura van Geest, Director of CPB: ‘The national debt is under control, interest rates are exceptionally low. This leaves room for temporary, targeted spending on public investments or transition costs — assuming the required discipline on the part of the government to stop there’.
| 2018 | 2019 | 2020 | |
|
GDP growth back to 1.5% |
2,6 | 1,8 | 1,5 |
|
Unemployment at lowest point in 2019 |
3,8 | 3,4 | 3,5 |
|
Inflation down in 2020 |
1,6 | 2,6 | 1,3 |
|
Higher contract wage increases continue |
2,0 | 2,5 | 2,5 |
|
Purchasing power increase continues in 2020 |
0,2 | 1,2 | 2,1 |
|
Surplus on government budget becomes smaller |
1,5 | 1,2 | 0,3 |
The labour market is projected to remain tight. The slowdown in production growth this year is reflected in the weak development of labour productivity. In 2020, employment growth will decline in the face of a sustained increase in labour supply. As a result, the decrease in unemployment will come to an end.
The not insignificant downward risks to the economy have increased further. US trade policy and related consequences, the increased likelihood of a chaotic Brexit, and political developments in Italy form substantial threats to the Dutch economy.
The way the detailed figures on purchasing power are presented has changed. These September Projections for the year 2019 are presented in both the old and the new way (see downloads below). The key figures can be found here.
Downloads
The global economy is slowing down due to increased uncertainty as a result of trade tensions. Global GDP growth is declining from 3.6% in 2018 to 3.1% in 2019 and 3.2% in 2020. As the growth in, particularly, import-intensive investments and sustainable consumer goods declines, the weakening of world trade is even more pronounced: from 4.3% in 2018 to 1.8% in 2019 and 2.3% in 2020. The slowdown in growth is mainly due to trade conflicts, which lead to major policy uncertainties.
Tekstkaders in MEV 2020
- Schuld zonder boete(n)?
- Onzekerheid rondom de raming
- Grenzen in zicht voor de ECB?
- Wie betaalt de hogere btw?
- Recordsurplus lopende rekening
- Zeventig jaar conjunctuurgolven
- Werkloosheid voorspellen met machine learning
- Dalende rente en beurskoersen
- Gevolgen van de Brexit: opties
- China en de Nederlandse uitvoer
- Begrotingsregels voor uitgaven in een notendop
- Effect komst kinderen op inkomen
- Aanpassing presentatie koopkrachtramingen van het CPB
Fan Charts September 2019
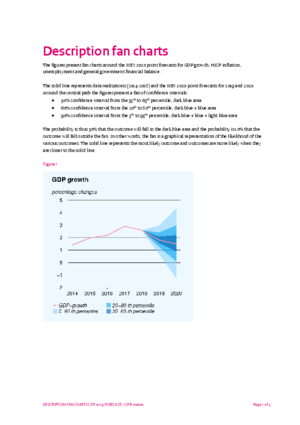
The figures present fan charts around the MEV 2020 point forecasts for GDP growth, HICP inflation, unemployment and general government financial balance.
The solid line represents data realizations (2014-2018) and the MEV 2020 point forecasts for 2019 and 2020. Around the central path the figures present a fan of confidence intervals:
- 30% confidence interval from the 35th to 65th percentile, dark blue area
- 60% confidence interval from the 20th to 80th percentile, dark blue + blue area
- 90% confidence interval from the 5th to 95th percentile, dark blue + blue + light blue area
The probability is thus 30% that the outcome will fall in the dark blue area and the probability is 10% that the outcome will fall outside the fan. In other words, the fan is a graphical representation of the likelihood of the various outcomes. The solid line represents the most likely outcome and outcomes are more likely when they are closer to the solid line.
Downloads
Authors

Bij iedere budgettaire raming geeft het CPB een afzonderlijke inschatting van de onzekerheid. Tabellen 2.1 en 2.2 geven een overzicht van alle gecertificeerde maatregelen. In paragraaf 2 wordt de certificering van enkele specifieke ramingen toegelicht. Datzelfde geldt voor de certificering van de onzekerheidsanalyse.
Authors
Voor de bekostiging van uitkeringen op grond van de Participatiewet ontvangen gemeenten een budget. De hoogte van het budget wordt bepaald op basis van een raming voor het aantal uitkeringsgerechtigden en de gemiddelde hoogte van een uitkering. Het CPB publiceert ramingen van het aantal bijstandsuitkeringen in het lopende en komende jaar in het Centraal Economisch Plan (CEP) in maart en in de Macro Economische Verkenning (MEV) in september. Het uitgangspunt in de raming is de ramingsregel die het verband weergeeft tussen mutaties in de werkloze beroepsbevolking (WBB) en de mutatie in de bijstand.
Authors

Multinationals do not justify the current size of the Dutch current account surplus. First, the sizable saving surplus of the non-financial corporations is only partly due to multinationals; small and medium-sized enterprises do play a role as well. Second, the upward distortion of the surplus due to retained earnings of multinationals is offset by the downward distortion of the surplus caused by foreign investments of pension funds. Retained earnings show up in de saving balance of corporations while they are a claim of the investors (foreign investors in the case of Dutch multinationals and Dutch pension funds in the case of foreign companies).
Measurement issues and profit shifting activities related to globalization could complicate assessments of the Dutch current account balance. The impact of issues like retained earnings, corporate inversion or movement of intellectual property on Dutch statistics so far seems limited.
Downloads
Authors
Het werkloosheidspercentage is een belangrijke arbeidsmarkindicator in de ramingen van het CPB. Het doel van dit onderzoek was om een model te ontwikkelen dat de kortetermijnwerkloosheidsraming (tot 24 maanden vooruit) kan verbeteren. Uit internationaal onderzoek blijkt dat werkloosheid goed kan worden voorspeld met machine learning -technieken. Dit is een vorm van data science, waarbij een algoritme patronen leert herkennen in een dataset.
Authors

De lastenontwikkeling wordt gerapporteerd op basis van de CPB-indicator: de beleidsmatige lastenontwikkeling (BLO) op EMU-basis. Een beleidsmutatie is een aanpassing van belasting- en premietarieven of een beleidsmatige aanpassing van de grondslag van belastingen en premies. De BLO-indicator is op EMU-basis om zo goed mogelijk bij de Nationale rekeningen van het CBS aan te sluiten. De aansluiting van de cijfers in dit achtergronddocument is op basis van de MEV 2020.
Authors

Het CPB deed onderzoek naar de determinanten van de arbeidsparticipatie van vrouwen op lange termijn, het effect van ouderschap op het inkomen en de collectieve baten van economische zelfstandigheid.
De mogelijkheden om met afzonderlijke beleidsmaatregelen vrouwen meer te laten werken zijn beperkt. Het bestaande belastingstelsel belast individuele inkomens; dit stimuleert vrouwen om meer te werken dan bij een belastingstelsel dat het huishoudinkomen belast. Een hogere kinderopvangtoeslag zet moeders in ieder geval op korte termijn ook aan om meer te werken. De kosten van kinderopvang worden in Nederland al voor een belangrijk deel gesubsidieerd via de kinderopvangtoeslag, zeker voor huishoudens met een relatief laag inkomen. Het betaald ouderschapsverlof is in Nederland relatief kort. Langer betaald ouderschapsverlof heeft vooral effect op de arbeid- en zorgverdeling tussen vaders en moeders vlak na de geboorte. Naarmate het kind ouder wordt blijft er een effect op de zorgverdeling tussen vaders en moeders, het effect op de arbeidsverdeling lijkt echter niet blijvend.
Het onderzoek vond plaats op verzoek van het ministerie van Onderwijs, Cultuur en Wetenschap en het Interdepartementaal Beleidsonderzoek Deeltijdwerk.
Authors


Downloads
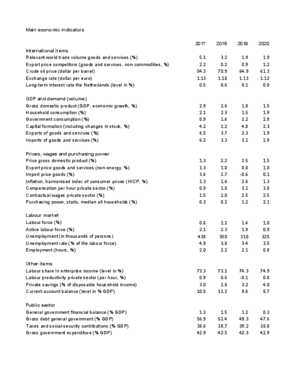
Table 'Main economic indicators', 2017-2020, 17 September 2019
| 2017 | 2018 | 2019 | 2020 | |
| Relevant world trade volume goods and services (%) | 5.1 | 3.2 | 1.9 | 1.9 |
| Export price competitors (goods and services, non-commodities, %) | 2.2 | 0.2 | 0.9 | 1.2 |
| Crude oil price (dollar per barrel) | 54.3 | 70.9 | 64.9 | 61.3 |
| Exchange rate (dollar per euro) | 1.13 | 1.18 | 1.13 | 1.12 |
| Long-term interest rate the Netherlands (level in %) | 0.5 | 0.6 | 0.1 | 0.0 |
| 2017 | 2018 | 2019 | 2020 | |
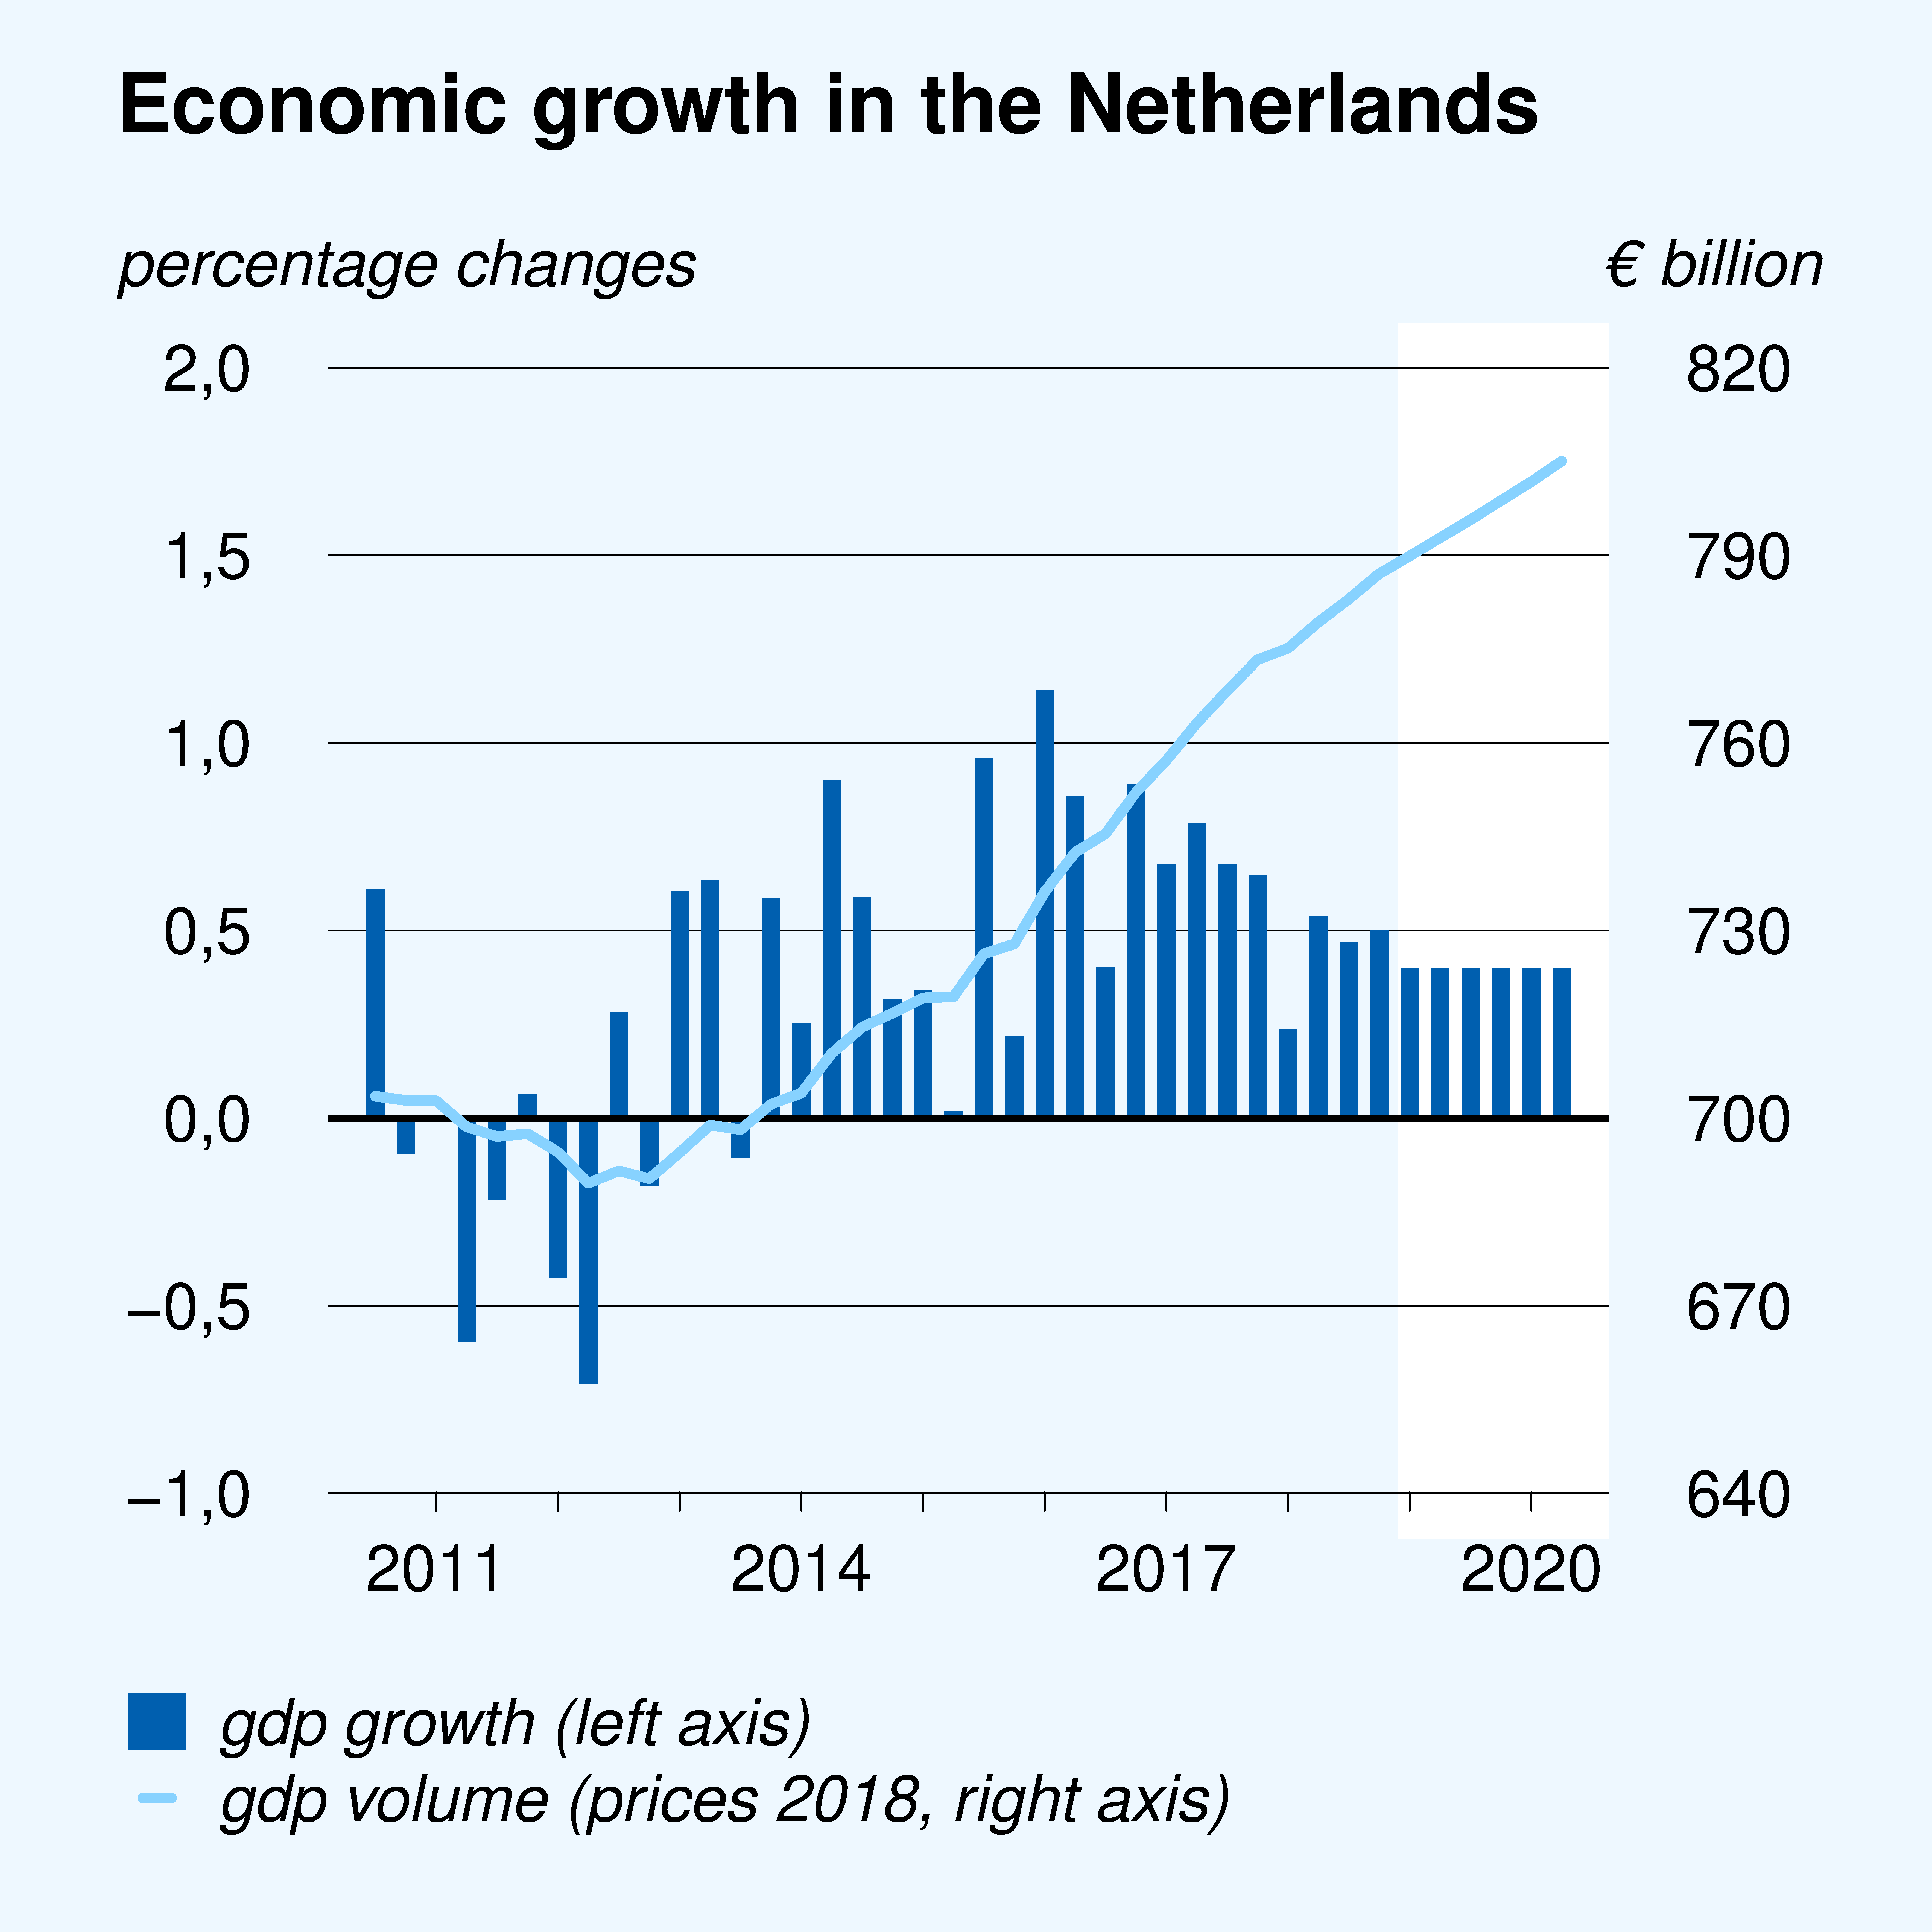
| Gross domestic product (GDP, economic growth, %) | 2.9 | 2.6 | 1.8 | 1.5 |
| Consumption households (%) | 2.1 | 2.3 | 1.5 | 1.9 |
| Consumption general government (%) | 0.9 | 1.6 | 2.2 | 2.9 |
| Capital formation including changes in stock (%) | 4.2 | 2.2 | 4.8 | 2.3 |
| Exports of goods and services (%) | 6.5 | 3.7 | 2.3 | 1.9 |
| Imports of goods and services (%) | 6.2 | 3.3 | 3.1 | 2.9 |
| 2017 | 2018 | 2019 | 2020 | |
| Price gross domestic product (%) | 1.3 | 2.2 | 2.5 | 1.5 |
| Export price goods and services (non-energy, %) | 1.3 | 1.0 | 0.8 | 1.0 |
| Import price goods (%) | 3.6 | 2.7 | -0.6 | 0.1 |
| Inflation, harmonised index of consumer prices (hicp, %) | 1.3 | 1.6 | 2.6 | 1.3 |
| Compensation per hour private sector (%) | 0.9 | 1.8 | 3.1 | 3.0 |
| Contractual wages private sector (%) | 1.5 | 2.0 | 2.5 | 2.5 |
| Purchasing power, static, median, all households (%) | 0.3 | 0.2 | 1.2 | 2.1 |
| 2017 | 2018 | 2019 | 2020 | |
| Labour force (%) | 0.8 | 1.2 | 1.4 | 1.0 |
| Active labour force (%) | 2.1 | 2.3 | 1.9 | 0.9 |
| Unemployment (in thousands of persons) | 438 | 350 | 310 | 325 |
| Unemployed rate (% of the labour force) | 4.9 | 3.8 | 3.4 | 3.5 |
| Employment (hours, %) | 2.0 | 2.2 | 2.1 | 0.8 |
| 2017 | 2018 | 2019 | 2020 | |
| Labour share in enterprise income (level in %) | 73.3 | 73.1 | 74.3 | 74.9 |
| Labour productivity private sector (per hour, %) | 0.9 | 0.6 | -0.1 | o.8 |
| Private savings (% of disposable household income) | 3.0 | 2.8 | 3.2 | 4.0 |
| Current-account balance (level in % GDP) | 10.8 | 11.2 | 9.6 | 8.7 |
| 2017 | 2018 | 2019 | 2020 | |
| General government financial balance (% GDP) | 1.3 | 1.5 | 1.2 | 0.3 |
| Gross debt general government (% GDP) | 56.9 | 52.4 | 49.3 | 47.6 |
| Taxes and social-security contributions (% GDP) | 38.6 | 38.7 | 39.2 | 38.8 |
| Gross government expenditure (% GDP) | 42.9 | 42.5 | 42.3 | 42.9 |
