
Concept Table Main Economic Indicators 2014-2017
Brexit slowing down economic growth in the Netherlands
Unemployment is projected to stabilise next year (at 6.2%) and the government deficit will decrease (to 0.6% of GDP). Inflation in the Netherlands will remain very low, with 0% this year and 0.5% in 2017. Development in median household purchasing power will drop from 2.7% this year to 0.7% in 2017. These results are published today in CPB’s interim projections which, so soon after the UK vote to leave the EU, are more uncertain than usual.
International growth
Global economic growth will be limited, among other things due to the low growth in emerging economies. World trade is also projected to grow at a slow pace. The eurozone’s economic growth will be affected negatively by the Brexit vote, with expected growth levels of 1.6% this year and 1.5% for 2017. In combination with the decline in trade with the United Kingdom, this will lead to lower relevant world trade, causing next year’s growth in Dutch exports to slightly slow down.
Domestic consumption
This year, consumption growth is limited. Next year, consumption will benefit from the increase of real wages and positive developments on the housing market, while the Brexit vote will have a negative effect.
Unemployment
The improving economy means that employment will grow, this year. Companies are expected to become a little more careful with hiring staff in the second half of this year, because of Brexit-related uncertainties. This causes next year’s growth in employment to taper off and unemployment to remain stable.
Government deficit
The government deficit will decrease from 1.2% this year to 0.6% next year. Tax revenues have been increasing rapidly, particularly those related to corporate income tax. The increase in government spending will remain moderate. The reduction in deficit in 2017 is in line with that mentioned in the Government Agreement of the Rutte-Asscher Cabinet. Figures include revenues from the announced phase-out of privately managed pension schemes (Pensioen in Eigen Beheer) for directors who are also large shareholders, and the revenues designated to additional government spending. The budget, as yet, is not in keeping with European fiscal rules on the structural balance and on government expenditures.
Purchasing power
The reduced purchasing-power development projected for 2017 is mainly due to the disappearance of the positive effects of the 5 billion euros in burden reduction and a slightly increasing inflation under a steady increase in contract wages in the market sector. For the employed, purchasing power is projected to increase by 1.1% next year, and for benefit recipients and pensioners to decrease by 0.1% and 0.7%, respectively.
Appendix: Questions and Answers for this projection.
Main conclusions
Read the accompanying press release.
Fan Charts
Take a look at the Fan Charts.
Economic growth in the Netherlands, 2008-2017
>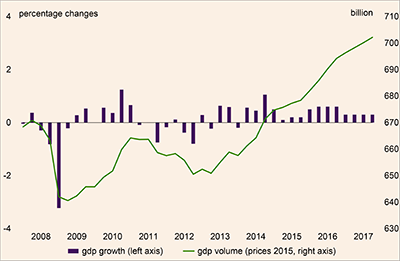
Table 'Main economic indicators', 2014-2017
| 2014 | 2015 | 2016 | 2017 | |
|---|---|---|---|---|
| Relevant world trade volume goods and services (%) |
3.9 |
3.8 |
3.4 |
3.2 |
| Export price competitors (goods and services, non-commodities, %) |
-1.3 |
6.0 |
-2.2 |
1.2 |
| Crude oil price (dollar per barrel) |
99.0 |
52.5 |
43.7 |
51.4 |
| Exchange rate (dollar per euro) |
1.33 |
1.11 |
1.11 |
1.11 |
| Long-term interest rate the Netherlands (level in %) |
1.5 |
0.7 |
0.2 |
0.1 |
| 2014 | 2015 | 2016 | 2017 | |
|---|---|---|---|---|
| Gross domestic product (GDP, economic growth, %) |
1.4 |
2.0 |
1.7 |
1.6 |
| Consumption households (%) |
0.3 |
1.8 |
1.3 |
1.7 |
| Consumption general government (%) |
0.3 |
0.2 |
0.8 |
1.0 |
| Capital formation including changes in stock (%) |
3.2 |
6.2 |
5.0 |
3.6 |
| Exports of goods and services (%) |
4.5 |
5.0 |
3.2 |
3.1 |
| Imports of goods and services (%) |
4.2 |
5.8 |
3.7 |
3.8 |
| 2014 | 2015 | 2016 | 2017 | |
|---|---|---|---|---|
| Price gross domestic product (%) |
0.1 |
0.1 |
0.5 |
0.9 |
| Export price goods and services (non-energy, %) |
-1.0 |
0.2 |
-1.5 |
0.9 |
| Import price goods (%) |
-2.7 |
-5.1 |
-3.7 |
2.1 |
| Inflation, harmonised index of consumer prices (hicp, %) |
0.3 |
0.2 |
0.0 |
0.5 |
| Contractual wages market sector (%) |
1.0 |
1.3 |
1.6 |
1.6 |
| Purchasing power, static, median, all households (%) |
1.3 |
1.1 |
2.7 |
0.7 |
| 2014 | 2015 | 2016 | 2017 | |
|---|---|---|---|---|
| Labour force (%) |
-0.4 |
0.4 |
0.3 |
0.8 |
| Active labour force (%) |
-0.6 |
1.0 |
1.0 |
0.8 |
| Unemployment (in thousands of persons) |
660 |
614 |
555 |
560 |
| Unemployed rate (% of the labour force) |
7.4 |
6.9 |
6.2 |
6.2 |
| 2014 | 2015 | 2016 | 2017 | |
|---|---|---|---|---|
| Production (%) |
2.4 |
2.8 |
2.2 |
2.2 |
| Labour productivity (hours, %) |
1.6 |
1.6 |
0.6 |
1.3 |
| Employment (hours, %) |
0.8 |
1.2 |
1.6 |
0.8 |
| Compensation per hour (%) |
0.8 |
0.2 |
2.3 |
2.1 |
| Labour share in enterprise income (level in %) |
78.7 |
77.1 |
78.1 |
78.1 |
| 2014 | 2015 | 2016 | 2017 | |
|---|---|---|---|---|
| Private savings (% of disposable household income) |
-1.4 |
0.2 |
2.2 |
1.6 |
| Current-account balance (level in % GDP) |
8.5 |
8.5 |
8.6 |
8.2 |
| 2014 | 2015 | 2016 | 2017 | |
|---|---|---|---|---|
| General government financial balance (% GDP) |
-2.3 |
-1.9 |
-1.2 |
-0.6 |
| Gross debt general government (% GDP) |
67.9 |
65.1 |
63.5 |
62.0 |
| Taxes and social security contributions (% GDP) |
37.5 |
37.7 |
38.3 |
38.6 |
CPB uses as of CEP 2016 hours worked instead of FTE as standard for labour input. This has implications for the figures on wage rates and employment. A CPB Background Document with more information is available (only in Dutch).
Downloads
