August projections 2020-2021
Renewed growth in Dutch economy from third quarter onwards, but downturn will reverberate

CPB director, Pieter Hasekamp: ‘The Netherlands is affected less severely by the corona crisis than some other countries. But, make no mistake, the magnitude of the negative impact is unprecedented and, for the most part, still has to make itself felt. There will be a delayed impact in the form of unemployment and bankruptcies. Job and income security hugely differs between sectors. Moreover, now more than ever, it is important to look beyond GDP. Neighbourliness, family visits and home schooling cannot be captured in economic growth figures. The corona crisis also has major consequences for things that affect quality of life; we miss jubilee and wedding celebrations, theatres and concert halls remain empty, and there are great concerns about people in nursing homes feeling lonely’.
| Baseline projections: | 2019 | 2020 | 2021 |
| Unprecedented decrease in GDP, followed by partial recovery | 1.7 | -5.1 | 3.2 |
| Unemployment increasing further in 2021 | 3.4 | 4.4 | 6.5 |
| Static purchasing power lower next year | 1.0 | 2.2 | 0.4 |
| Large government budget deficit | 1.7 | -7.1 | -4.1 |
| Debt will stabilise at substantially higher level (% of GDP) | 48.7 | 59.9 | 59.7 |
Static purchasing power will increase in 2020, as a result of already agreed wage increases, moderate inflation and cost reductions of, on average, more than 2%. In 2021, wage development and purchasing power increases will be more moderate. In interpreting these figures, however, it should also be taken into account that job dismissals and reduced earnings for the self-employed cause considerable income losses for large numbers of people, and that the government has taken on a share of the wage costs.
Public finances were hit hard by the financial support measures and lower tax revenues, but are in no real danger. Under these baseline projections, support measures will lead to an unprecedented budget deficit of 7% in 2020. In 2021, this deficit will recover to 4%. Public debt stabilises at 60% of GDP, in the baseline projections. In the case of a ‘second wave’ scenario, this will increase to 73% by the end of 2021, which would still be below levels that are considered risky. As a result, and given the cyclical situation, there are no obvious reasons for taking immediate measures to reduce the deficit.
On Prinsjesdag (the day of the King's Speech in which the main features of government policy for the coming parliamentary session are announced; this year on 15 September), CPB’s Macro Economic Outlook 2021 (MEV) will be published. The Outlook incorporates all decision-making regarding the 2021 budget. It will also elaborate on the corona crisis-related consequences for inequality. An update of the medium-term outlook will also be published on Prinsjesday, describing the expected economic developments for the coming cabinet period.
he Dutch Cabinet uses these projections as a basis for its decisions on next year’s policy and purchasing power. On 15 September 2020, the day of the King's Speech in which the main features of government policy for the coming parliamentary session are announced ("Prinsjesdag"), the Macro Economic Outlook 2021 (MEV) will be published, containing the final projections and their explanation, as well as a detailed analysis of the Dutch economic situation.
Downloads
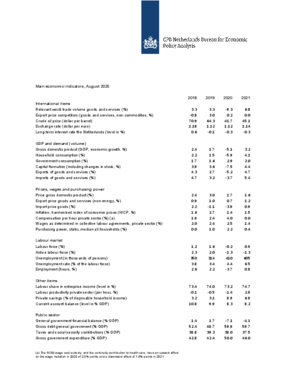
Table 'Main economic indicators', 2018-2021, August 2020
| 2018 | 2019 | 2020 | 2021 | |
| Relevant world trade volume goods and services (%) | 3.3 | 3.3 | -9.3 | 6.8 |
| Export price competitors (goods and services, non-commodities, %) | -0.8 | 3.0 | 0.2 | 0.0 |
| Crude oil price (dollar per barrel) | 70.9 | 64.3 | 41.7 | 45.1 |
| Exchange rate (dollar per euro) | 1.18 | 1.12 | 1.12 | 1.14 |
| Long-term interest rate the Netherlands (level in %) | 0.6 | -0.1 | -0.3 | -0.3 |
| 2018 | 2019 | 2020 | 2021 | |
| Gross domestic product (GDP, economic growth, %) | 2.4 | 1.7 | -5.1 | 3.2 |
| Household consumption (%) | 2.2 | 1.5 | -5.9 | 4.1 |
| Government consumption (%) | 1.7 | 1.6 | 2.9 | 2.0 |
| Capital formation including changes in stock (%) | 3.9 | 3.6 | -7.5 | 4.4 |
| Exports of goods and services (%) | 4.3 | 2.7 | -5.2 | 4.7 |
| Imports of goods and services (%) | 4.7 | 3.2 | -3.7 | 5.4 |
| 2018 | 2019 | 2020 | 2021 | |
| Price gross domestic product (%) | 2.4 | 3.0 | 1.7 | 1.6 |
| Export price goods and services (non-energy, %) | 0.9 | 1.0 | 0.7 | 1.2 |
| Import price goods (%) | 2.2 | -1.1 | -3.9 | 0.9 |
| Inflation, harmonised index of consumer prices (HICP, %) | 1.6 | 2.7 | 1.4 | 1.5 |
| Compensation per hour private sector (%) (a) | 1.9 | 2.4 | 4.0 | 0.0 |
| Wages as determined in collective labour agreements, private sector (%) | 2.0 | 2.4 | 2.5 | 1.4 |
| Purchasing power, static, median all households (%) | 0.0 | 1.0 | 2.2 | 0.4 |
| 2018 | 2019 | 2020 | 2021 | |
| Labour force (%) | 1.2 | 1.6 | -0.2 | 0.9 |
| Active labour force (%) | 2.3 | 2.0 | -1.3 | -1.3 |
| Unemployment (in thousands of persons) | 350 | 314 | 410 | 605 |
| Unemployed rate (% of the labour force) | 3.8 | 3.4 | 4.4 | 6.5 |
| Employment (hours, %) | 2.6 | 2.2 | -3.7 | 0.8 |
| 2018 | 2019 | 2020 | 2021 | |
| Labour share in enterprise income (level in %) | 73.4 | 74.0 | 73.2 | 74.7 |
| Labour productivity private sector (per hour, %) | -0.1 | -0.5 | -1.4 | 2.9 |
| Private savings (% of disposable household income) | 3.2 | 3.1 | 8.9 | 6.9 |
| Current-account balance (level in % GDP) | 10.8 | 9.9 | 8.3 | 8.2 |
| 2018 | 2019 | 2020 | 2021 | |
| General government financial balance (% GDP) | 1.4 | 1.7 | -7.1 | -4.1 |
| Gross debt general government (% GDP) | 52.4 | 48.7 | 59.9 | 59.7 |
| Taxes and social security contributions (% GDP) | 38.8 | 39.3 | 38.0 | 37.5 |
| Gross government expenditure (% GDP) | 42.8 | 42.4 | 50.0 | 46.0 |
(a) The NOW wage cost subsidy, and the continuity contribution to health care, have an upward effect on the wage mutation in 2020 of 2.0%-points and a downward effect of 1.8%-points in 2021.
Contacts

