Projections August 2021
Resilient economic recovery, but uncertainty around corona remains

The economic outlook’s main uncertainty concerns the development of the pandemic. In the unfortunate event that large-scale restrictions on economic activity become necessary again, this will directly affect economic development.
| Baseline projections: | 2020 | 2021 | 2022 |
| Resilient recovery after restrictive measures are lifted (GDP growth, %) | -3.8 | 3.8 | 3.2 |
| Unemployment hardly increases after support measures are terminated (%) | 3.8 | 3.4 | 3.6 |
| Static purchasing power limited due to lower real wage growth (%) | 2.5 | 0.8 | 0.0 |
| Government deficit in 2022 much smaller due to termination of support (% GDP) | -4.2 | -5.3 | -1.8 |
| Government debt decreases due to denominator effect (% GDP) | 54.3 | 57.4 | 56.0 |
Although the economy as a whole is recovering rapidly, the presence of the coronavirus remains a significant factor. As a result of the uncertainty, the targeted contact restrictions and/or shift in demand, a limited number of sectors are still affected by COVID-19 and perhaps will continue to be, indefinitely. Adjustments in the way of business closures will then be inevitable and desirable, from an economic perspective — particularly, given the tight labour market in sectors that are unaffected by the coronavirus or that are seeing additional demand as a result. The announced termination of generic support measures after the third quarter supports this necessary adjustment.
Government finances are recovering in line with economic development. In 2021, there will still be a budget deficit of 5.3%, which will decrease in 2022 to 1.8% as a result of the termination of support measures and the increase in tax revenues. The rapid GDP growth will cause public debt to decrease again, measured as a percentage of the economy.
Static purchasing power development will decline, because of the wage development’s delayed response to the coronavirus crisis, while inflation rises slightly due to increased raw material prices. In 2021, average purchasing power will still increase by 0.8% as a result of the reduction in the financial burden; without further policy, the average development in 2022 will be 0.0%.
Downloads
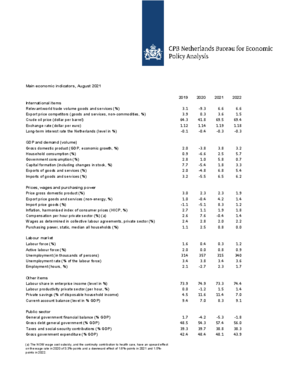
Table 'Main economic indicators', 2019-2022, August 2021
| 2019 | 2020 | 2021 | 2022 | |
| Relevant world trade volume goods and services (%) | 3.1 | -9.3 | 6.6 | 6.6 |
| Export price competitors (goods and services, non-commodities, %) | 3.9 | 0.3 | 3.6 | 1.5 |
| Crude oil price (dollar per barrel) | 64.3 | 41.8 | 69.5 | 69.4 |
| Exchange rate (dollar per euro) | 1.12 | 1.14 | 1.19 | 1.18 |
| Long-term interest rate the Netherlands (level in %) | -0.1 | -0.4 | -0.3 | -0.3 |
| 2019 | 2020 | 2021 | 2022 | |
| Gross domestic product (GDP, economic growth, %) | 2.0 | -3.8 | 3.8 | 3.2 |
| Household consumption (%) | 0.9 | -6.6 | 2.5 | 5.7 |
| Government consumption (%) | 2.8 | 1.0 | 5.8 | 0.7 |
| Capital formation including changes in stock (%) | 7.7 | -5.4 | 1.8 | 3.3 |
| Exports of goods and services (%) | 2.0 | -4.8 | 6.8 | 5.4 |
| Imports of goods and services (%) | 3.2 | -5.5 | 6.5 | 6.2 |
| 2019 | 2020 | 2021 | 2022 | |
| Price gross domestic product (%) | 3.0 | 2.3 | 2.3 | 1.9 |
| Export price goods and services (non-energy, %) | 1.0 | -0.4 | 4.2 | 1.4 |
| Import price goods (%) | -1.1 | -5.1 | 8.3 | 1.2 |
| Inflation, harmonised index of consumer prices (HICP, %) | 2.7 | 1.1 | 1.9 | 1.8 |
| Compensation per hour private sector (%) (a) | 2.6 | 7.6 | -0.4 | 1.4 |
| Wages as determined in collective labour agreements, private sector (%) | 2.4 | 2.8 | 2.0 | 2.2 |
| Purchasing power, static, median all households (%) | 1.1 | 2.5 | 0.8 | 0.0 |
| 2019 | 2020 | 2021 | 2022 | |
| Labour force (%) | 1.6 | 0.4 | 0.3 | 1.2 |
| Active labour force (%) | 2.0 | 0.0 | 0.8 | 0.9 |
| Unemployment (in thousands of persons) | 314 | 357 | 315 | 340 |
| Unemployed rate (% of the labour force) | 3.4 | 3.8 | 3.4 | 3.6 |
| Employment (hours, %) | 2.1 | -2.7 | 2.3 | 1.7 |
| 2019 | 2020 | 2021 | 2022 | |
| Labour share in enterprise income (level in %) | 73.9 | 74.9 | 73.3 | 74.4 |
| Labour productivity private sector (per hour, %) | 0.0 | -1.2 | 1.5 | 1.4 |
| Private savings (% of disposable household income) | 4.5 | 11.6 | 11.4 | 7.0 |
| Current-account balance (level in % GDP) | 9.4 | 7.0 | 8.3 | 9.1 |
| 2019 | 2020 | 2021 | 2022 | |
| General government financial balance (% GDP) | 1.7 | -4.2 | -5.3 | -1.8 |
| Gross debt general government (% GDP) | 48.5 | 54.3 | 57.4 | 56.0 |
| Taxes and social security contributions (% GDP) | 39.3 | 39.7 | 38.8 | 38.3 |
| Gross government expenditure (% GDP) | 42.4 | 48.4 | 48.1 | 43.9 |
(a) The NOW wage cost subsidy, and the continuity contribution to health care, have an upward effect on the wage mutation in 2020 of 3.3%-points and a downward effect of 1.6%-points in 2021 and 1.5%-points in 2022.
Contacts


