
June 3, 2016
CPB's short-term forecasts June 2016
Economic growth is continuing, for an important part as a result of domestic spending. The economy is projected to grow by 1.8% this year and by 2.1% in 2017. Consumption levels will increase by 1.5% this year and 2.1% next year, due to an increase in household disposable income under continued low inflation. For both years, investments are projected to grow by more than GDP. Public spending will lag behind economic growth. These are some of the conclusions in the June Projections 2016 by CPB Netherlands Bureau for Economic Policy Analysis.
Main conclusions
Read the accompanying press release and publication (only in Dutch).
Fan Charts
Take a look at the Fan Charts.
Economic growth in the Netherlands, 2008-2017
>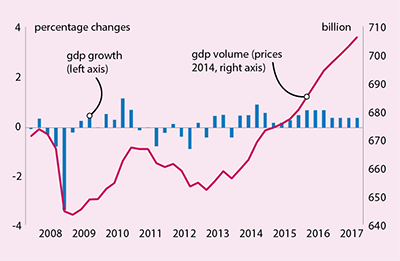
Table 'Main economic indicators', 2014-2017
| 2014 | 2015 | 2016 | 2017 | |
|---|---|---|---|---|
| Relevant world trade volume goods and services (%) |
3.9 |
4.0 |
3.9 |
4.8 |
| Export price competitors (goods and services, non-commodities, %) |
-1.3 |
7.1 |
-1.6 |
1.7 |
| Crude oil price (dollar per barrel) |
99.0 |
52.5 |
42.0 |
47.4 |
| Exchange rate (dollar per euro) |
1.33 |
1.11 |
1.13 |
1.13 |
| Long-term interest rate the Netherlands (level in %) |
1.5 |
0.7 |
0.4 |
0.3 |
| 2014 | 2015 | 2016 | 2017 | |
|---|---|---|---|---|
| Gross domestic product (GDP, economic growth, %) |
1.0 |
2.0 |
1.8 |
2.1 |
| Consumption households (%) |
0.0 |
1.5 |
1.5 |
2.1 |
| Consumption general government (%) |
0.3 |
0.1 |
1.1 |
0.2 |
| Capital formation including changes in stock (%) |
2.7 |
8.2 |
6.0 |
3.9 |
| Exports of goods and services (%) |
4.0 |
5.3 |
5.1 |
4.5 |
| Imports of goods and services (%) |
4.0 |
6.4 |
6.3 |
4.7 |
| 2014 | 2015 | 2016 | 2017 | |
|---|---|---|---|---|
| Price gross domestic product (%) |
0.8 |
0.4 |
0.7 |
0.9 |
| Export price goods and services (non-energy, %) |
-0.7 |
0.8 |
-0.5 |
1.4 |
| Import price goods (%) |
-3.1 |
-5.2 |
-3.3 |
2.8 |
| Inflation, harmonised index of consumer prices (hicp, %) |
0.3 |
0.2 |
0.1 |
0.9 |
| Contractual wages market sector (%) |
1.0 |
1.3 |
1.6 |
1.7 |
| Purchasing power, static, median, all households (%) |
1.4 |
1.0 |
2.6 |
0.2 |
| 2014 | 2015 | 2016 | 2017 | |
|---|---|---|---|---|
| Labour force (%) |
-0.4 |
0.4 |
0.3 |
1.3 |
| Active labour force (%) |
-0.6 |
1.0 |
0.8 |
1.6 |
| Unemployment (in thousands of persons) |
660 |
614 |
575 |
560 |
| Unemployed rate (% of the labour force) |
7.4 |
6.9 |
6.4 |
6.2 |
| 2014 | 2015 | 2016 | 2017 | |
|---|---|---|---|---|
| Production (%) |
1.9 |
2.6 |
2.3 |
2.7 |
| Labour productivity (hours, %) |
1.4 |
1.0 |
0.9 |
1.4 |
| Employment (hours, %) |
0.5 |
1.5 |
1.3 |
1.3 |
| Compensation per hour (%) |
1.7 |
1.2 |
2.4 |
2.3 |
| Labour share in enterprise income (level in %) |
79.2 |
78.0 |
78.4 |
78.8 |
| 2014 | 2015 | 2016 | 2017 | |
|---|---|---|---|---|
| Private savings (% of disposable household income) |
0.8 |
1.0 |
2.4 |
1.9 |
| Current-account balance (level in % GDP) |
10.6 |
9.2 |
9.0 |
8.8 |
| 2014 | 2015 | 2016 | 2017 | |
|---|---|---|---|---|
| General government financial balance (% GDP) |
-2.4 |
-1.8 |
-1.6 |
-1.0 |
| Gross debt general government (% GDP) |
68.2 |
65.1 |
64.5 |
63.1 |
| Taxes and social security contributions (% GDP) |
37.5 |
37.5 |
37.7 |
37.8 |
CPB uses as of CEP 2016 hours worked instead of FTE as standard for labour input. This has implications for the figures on wage rates and employment. A CPB Background Document with more information is available (only in Dutch).
Downloads

English, Pdf, 1.5 MB
English, Excel, 103.5 KB
English, Excel, 101.5 KB
Contacts
