
Concept Table Main Economic Indicators 2015-2018
Strong acceleration of economic growth
Go straight to the data.
The new figures for 2017 and 2018, published today in the preliminary version of the Macro Economic Outlook 2018 (cMEV), clearly provide a more positive image than those in the June projections. This is mainly attributed to the very favourable development of Dutch exports.
Main figures for 2017 and 2018
- Economic development: growth of 3.3% in 2017 and 2.5% in 2018
- Decreasing unemployment: 4.9% in 2017, further decreasing to 4.3% in 2018
- Inflation: 1.3% in both 2017 and 2018
- Increasing budget surplus: the EMU balance will be 0.6% of GDP in 2017 and 0.9% in 2018
- Government debt will continue to decrease: 57% of GDP in 2017 and 54% in 2018
Because of the further improvement in the economy, unemployment is projected to decrease more rapidly, as well; down to 4.3% by 2018. Furthermore, the increasing budget surplus and strongly decreasing government debt represent healthy public finances. Despite the recently announced additional expenditure on nursing care, CPB projects a slight improvement in the EMU balance, for both 2017 (+0.1 percentage points of GDP) and 2018 (+0.2 percentage points). In addition, projections regarding the inflation (HICP) have been revised slightly downward. This is closely related to the lower oil price and stronger euro. Median purchasing power will increase in 2017 and 2018, by 0.3 % and 0.5%, respectively. For 2018, this is 0.3 percentage points more favourable than stated in the June projections, which is mainly due to the downward revision of the inflation figure.
Projections for the medium term: 2018 through 2021
Together with the cMEV, the medium-term outlook for 2018–2021 of March of this year has also been updated:
- Development in economic growth in 2018 through 2021: annual average of 1.8%
- Unemployment is projected to be 4.6% by 2021
- Inflation over the 2018–2021 period is projected at an annual average of 1.5%
- Government budget 2021: surplus of 1.6% of GDP at a government debt of 45% of GDP
The sustainability balance — which indicates whether the government budget, under a continuation of the current level of regulations and services, will also be tenable in the long term — will be positive, at 0.2%. Compared to the March projections, this represents a decline of 0.3 percentage points. This alleviates the negative impact of the recently announced additional expenditure on nursing care — as the further improvement in economic growth, under unchanging expenditure over the medium term, will also lead to increased sustainability.
Main conclusions
Read the accompanying press release.
Economic growth in the Netherlands, 2008-2018
>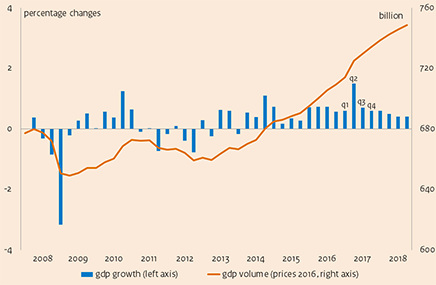
Table 'Main economic indicators', 2015-2018 (a)
| 2015 | 2016 | 2017 | 2018 | |
|---|---|---|---|---|
| Relevant world trade volume goods and services (%) |
3.8 |
3.6 |
4.3 |
4.0 |
| Export price competitors (goods and services, non-commodities, %) |
7.9 |
-3.7 |
0.6 |
0.0 |
| Crude oil price (dollar per barrel) |
51.9 |
43.3 |
49.3 |
49.5 |
| Exchange rate (dollar per euro) |
1.11 |
1.11 |
1.11 |
1.14 |
| Long-term interest rate the Netherlands (level in %) |
0.7 |
0.3 |
0.6 |
0.8 |
| 2015 | 2016 | 2017 | 2018 | |
|---|---|---|---|---|
| Gross domestic product (GDP, economic growth, %) |
2.3 |
2.2 |
3.3 |
2.5 |
| Consumption households (%) |
2.0 |
1.6 |
2.2 |
2.3 |
| Consumption general government (%) |
-0.2 |
1.2 |
0.5 |
1.6 |
| Capital formation including changes in stock (%) |
11.2 |
3.1 |
6.3 |
4.7 |
| Exports of goods and services (%) |
6.5 |
4.3 |
4.9 |
4.5 |
| Imports of goods and services (%) |
8.4 |
4.1 |
4.4 |
5.1 |
| 2015 | 2016 | 2017 | 2018 | |
|---|---|---|---|---|
| Price gross domestic product (%) |
0.8 |
0.6 |
1.1 |
1.6 |
| Export price goods and services (non-energy, %) |
1.5 |
-0.9 |
1.0 |
0.3 |
| Import price goods (%) |
-5.4 |
-4.4 |
3.6 |
-0.5 |
| Inflation, harmonised index of consumer prices (hicp, %) |
0.2 |
0.1 |
1.3 |
1.3 |
| Compensation per hour private sector (%) |
-0.2 |
0.6 |
2.2 |
3.2 |
| Contractual wages private sector (%) |
1.2 |
1.5 |
1.6 |
2.2 |
| Purchasing power, static, median, all households (%) |
1.0 |
2.7 |
0.3 |
0.5 |
| 2015 | 2016 | 2017 | 2018 | |
|---|---|---|---|---|
| Labour force (%) |
0.4 |
0.4 |
0.8 |
1.1 |
| Active labour force (%) |
1.0 |
1.3 |
2.0 |
1.7 |
| Unemployment (in thousands of persons) |
614 |
538 |
440 |
395 |
| Unemployed rate (% of the labour force) |
6.9 |
6.0 |
4.9 |
4.3 |
| Employment (hours, %) |
0.6 |
2.0 |
2.0 |
1.6 |
| 2015 | 2016 | 2017 | 2018 | |
|---|---|---|---|---|
| Labour share in enterprise income (level in %) |
72.2 |
72.9 |
72.4 |
72.9 |
| Labour productivity private sector (per hour, %) |
1.5 |
0.4 |
1.5 |
0.9 |
| Private savings (% of disposable household income) |
-0.4 |
0.3 |
0.3 |
0.5 |
| Current-account balance (level in % GDP) |
8.3 |
8.7 |
8.8 |
8.6 |
| 2015 | 2016 | 2017 | 2018 | |
|---|---|---|---|---|
| General government financial balance (% GDP) |
-2.1 |
0.4 |
0.6 |
0.9 |
| Gross debt general government (% GDP) |
64.6 |
61.8 |
57.2 |
53.8 |
| Taxes and social security contributions (% GDP) |
37.3 |
38.7 |
38.8 |
38.8 |
| Gross government expenditure (% GDP) |
45.2 |
43.8 |
42.9 |
42.4 |
(a) CPB uses as of MEV 2018 a new method for the calculation of the labour share in enterprise income. This new method takes better account of the income of self-employed persons and therefore better matches current economic reality. A joint 'notitie' of CBS, CPB and DNB is available on this subject (only in Dutch).
Downloads
