
Projections September 2024 (MEV 2025)
Purchasing power gains dampened by delayed financial relief

Expenditure postponed to later years
The government assumes that it will not be able to realise all budgeted expenditure in the short term, which is why some spending has been deferred to later years. This reduces the current budget deficit from 2.2% to 1.8% of GDP. Although the budget deficit will remain below the European limit of 3% of GDP in the years ahead, it is edging closer to the agreed guard rail and on track to exceed the limit from 2029 onwards.
Poverty targets met
In the outline coalition agreement, the cabinet parties agreed that poverty rates should not increase from the 2024 levels during their term of office. In the draft MEV, this target was not met for child poverty, but plans to gradually increase the child-related budget have resolved this. Choosing this kind of targeted measure to achieve the poverty targets is at odds, however, with the desire to eventually abolish the system of allowances.
The Macro Economic Outlook 2025 sets out the changes from the draft MEV. The underlying economic estimates have remained the same – the changes between the two versions were made solely to reflect the government’s budget adjustments.
| 2023 | 2024 | 2025 | 2025-2028 | |
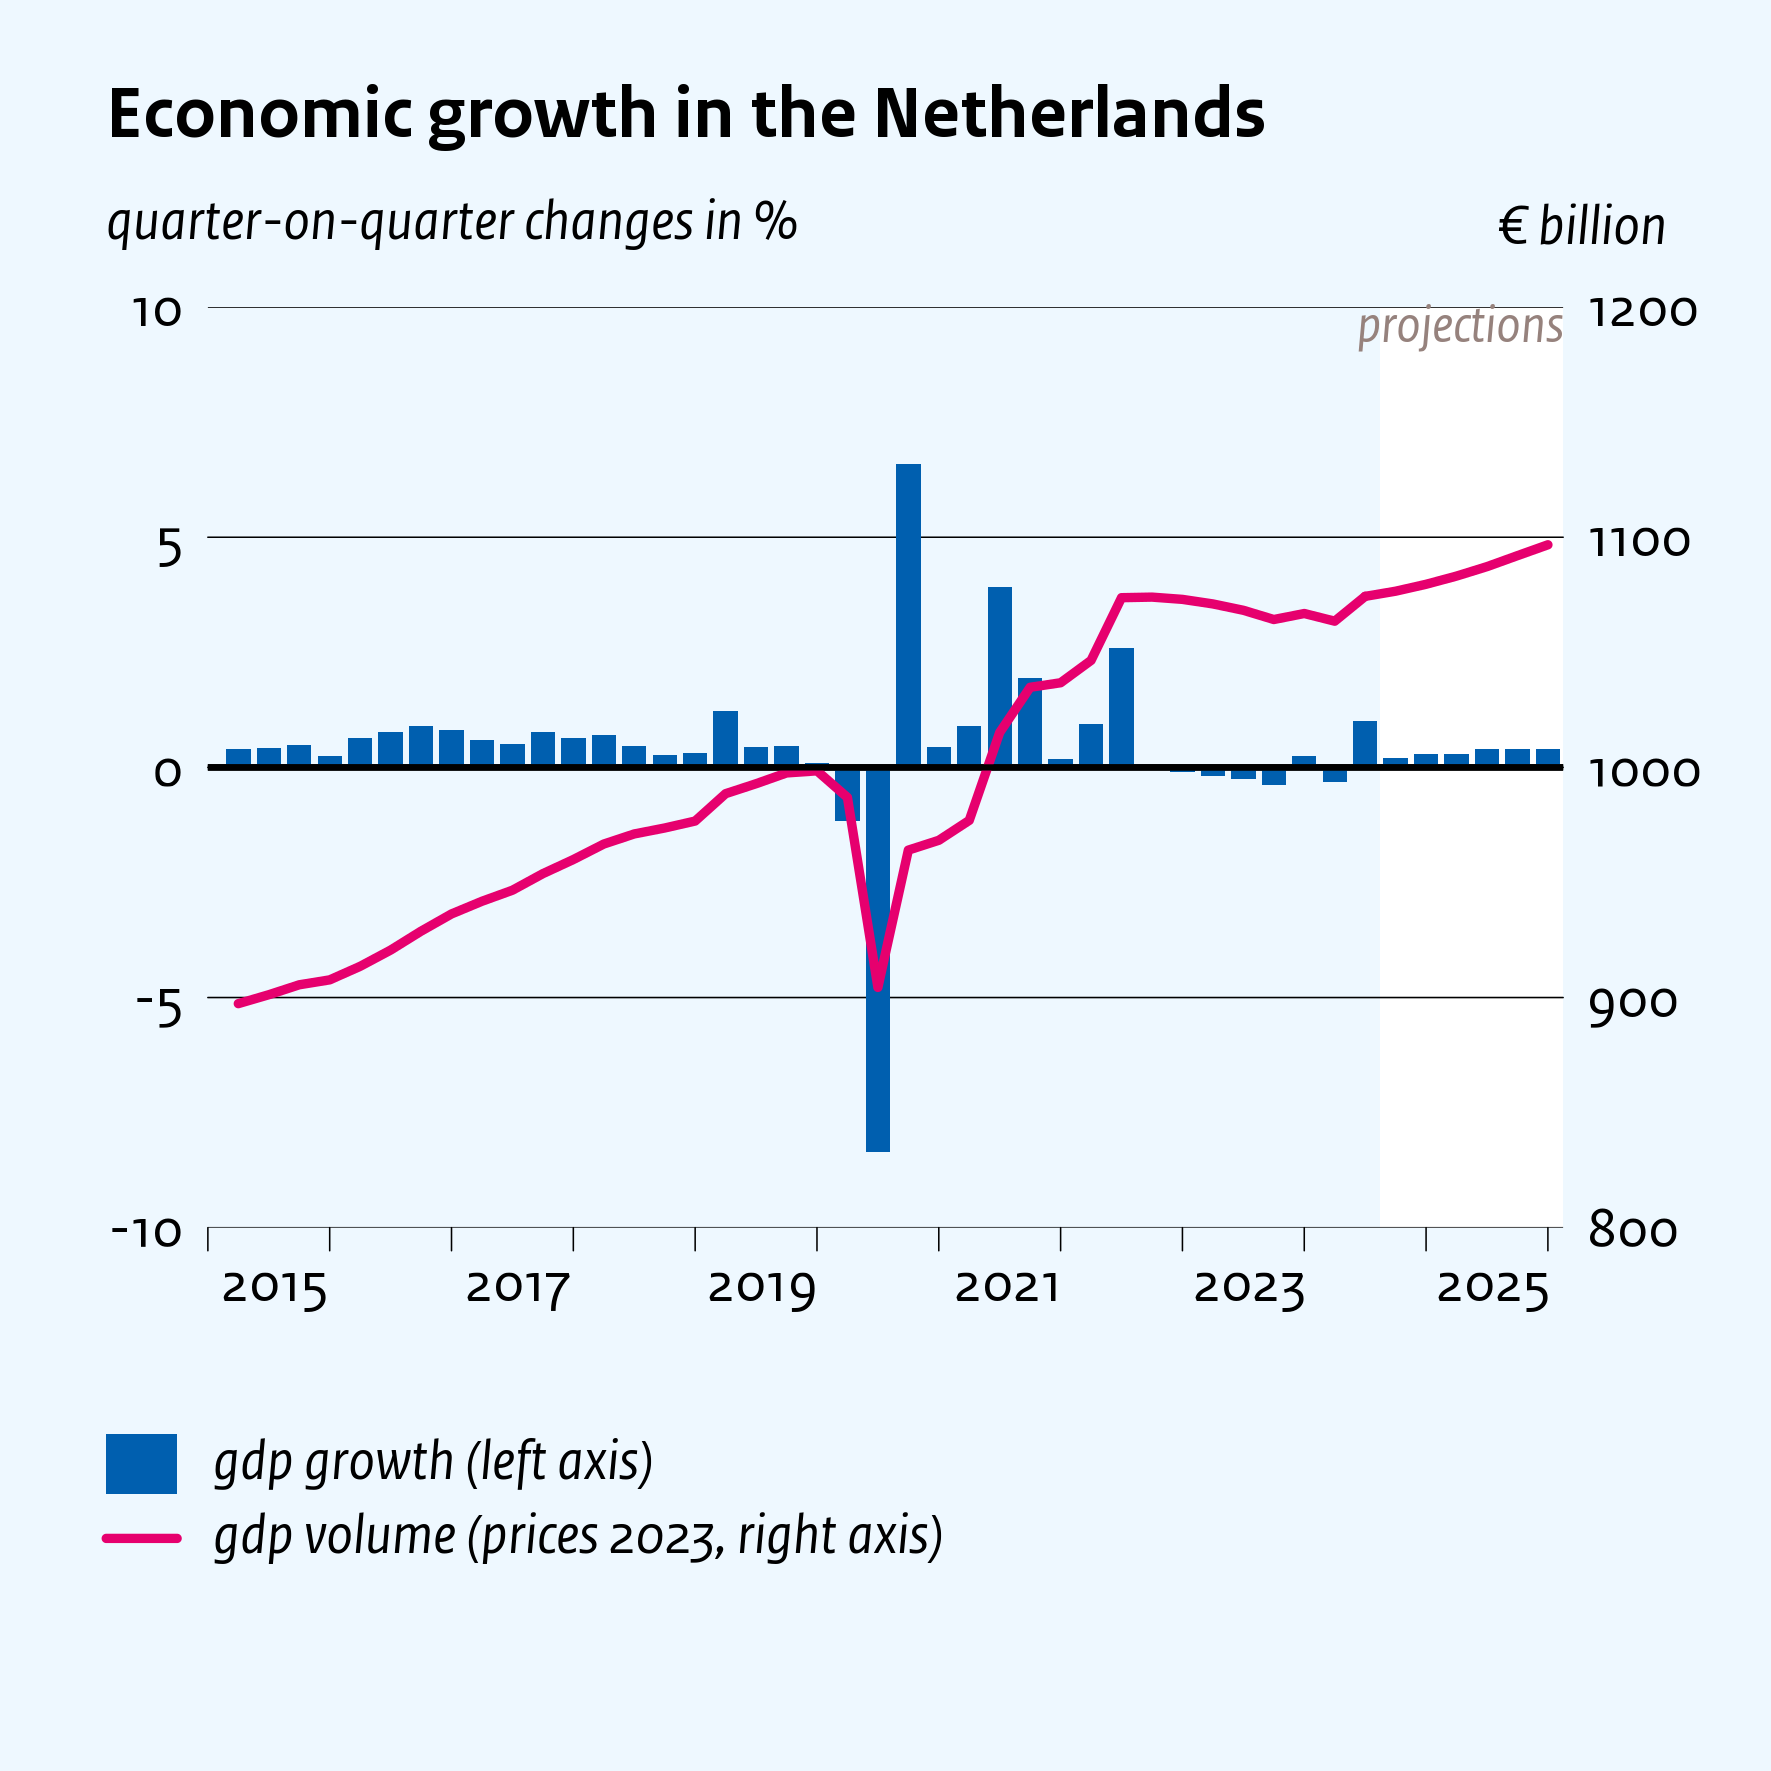
| Return to GDP growth ( % per year) | 0.1 | 0.6 | 1.5 | 1.4 |
| Unemployed remains low (% of the labour force) (a) | 3.6 | 3.7 | 3.8 | 4.5 |
| Purchasing power recovers (median, % per year) | -0.6 | 2.5 | 0.7 | 0.8 |
| Poverty remains low (persons, in %) (a) | 4.6 | 4.5 | 4.4 | 4.4 |
| General deficit deepens (% GDP) (a) | -0.4 | -1.8 | -2.5 | -2.5 |
(a) Column 2025-2028 shows the level in the final year (2028)
.
Downloads

Lees ook de MEV 2025. Daarnaast is er een actualisatie van de cijfers op middellange termijn gedaan.
Contacts


Authors


Voor de bekostiging van uitkeringen op grond van de Participatiewet ontvangen gemeenten een budget van het ministerie van Sociale Zaken en Werkgelegenheid. De hoogte van het budget wordt bepaald op basis van een raming voor het aantal uitkeringsgerechtigden en de gemiddelde hoogte van een bijstandsuitkering. Het CPB publiceert ramingen van het aantal bijstandsuitkeringen in het lopende en komende jaar in het Centraal Economisch Plan (CEP) in februari/maart en in de MEV in september.
Authors

In totaal zijn 28 fiscale maatregelen aan een uitvoerige toetsing onderworpen. Deze maatregelen zijn beoordeeld vanwege een geraamd budgettair effect van tenminste 50 mln euro, grote gedragseffecten of een sterk onzekere grondslag.
Authors


Downloads

Table 'Main economic indicators', 2022-2025, September 2024
| 2022 | 2023 | 2024 | 2025 | |
| Relevant world trade volume goods and services (%) | 7.8 | -0.4 | 1.1 | 2.8 |
| Export price competitors (goods and services, non-commodities, %) | 15.2 | -1.9 | 1.1 | 1.6 |
| Crude oil price (dollar per barrel) | 100.8 | 82.5 | 83 | 77.2 |
| Exchange rate (dollar per euro) | 1.05 | 1.08 | 1.08 | 1.10 |
| Long-term interest rate the Netherlands (level in %) | 1.5 | 2.8 | 2.7 | 2.7 |
| 2022 | 2023 | 2024 | 2025 | |
| Gross domestic product (GDP, economic growth, %) | 5.0 | 0.1 | 0.6 | 1.5 |
| Household consumption (%) | 6.9 | 0.8 | 0.7 | 2.7 |
| Government consumption (%) | 1.3 | 2.9 | 2.5 | 1.3 |
| Capital formation including changes in stock (%) | 5.6 | -9.1 | -3.2 | 3.7 |
| Exports of goods and services (%) | 4.4 | -0.5 | -0.4 | 2.4 |
| Imports of goods and services (%) | 4.4 | -1.8 | -0.7 | 3.7 |
| 2022 | 2023 | 2024 | 2025 | |
| Price gross domestic product (%) | 6.2 | 7.3 | 5.1 | 2.7 |
| Export price goods and services (%) | 19.1 | -0.9 | 1.0 | 1.7 |
| Import price goods and services (%) | 22.1 | -3.4 | -0.7 | 1.4 |
| Inflation, national consumer price index (CPI, %) | 10.0 | 3.8 | 3.6 | 3.2 |
| Alternative CPI (purchasing power and poverty figures) (%) | 6.8 | 7.8 | 3.4 | 3.2 |
| Inflation, harmonised index of consumer prices (HICP, %) | 11.6 | 4.1 | 3.5 | 2.8 |
| Compensation per hour private sector (%) | 3.2 | 6.6 | 7.0 | 5.2 |
| Wages as determined in collective labour agreements, private sector (%) | 3.1 | 5.9 | 6.6 | 4.3 |
| Purchasing power, static, median all households (%) | -2.5 | -0.6 | 2.5 | 0.7 |
| People in poverty (level in %) | 4.8 | 4.6 | 4.5 | 4.4 |
| 2022 | 2023 | 2024 | 2025 | |
| Labour force (%) | 2.4 | 2.0 | 1.0 | 0.6 |
| Active labour force (%) | 3.2 | 2.0 | 0.9 | 0.4 |
| Unemployment (in thousands of persons) | 350 | 359 | 375 | 390 |
| Unemployed rate (% of the labour force) | 3.5 | 3.6 | 3.7 | 3.8 |
| Employment (hours, %) | 3.9 | 1.4 | 0.7 | 0.2 |
| 2022 | 2023 | 2024 | 2025 | |
| Labour share in enterprise income (level in %) | 67.8 | 67.6 | 68.8 | 68.8 |
| Labour productivity private sector (per hour, %) | 1.8 | -1.2 | -0.3 | 1.3 |
| Private savings (% of disposable household income) | 1.3 | 1.9 | 5.5 | 6.2 |
| Current-account balance (level in % GDP) | 6.6 | 9.9 | 10.8 | 10.0 |
| 2022 | 2023 | 2024 | 2025 | |
| General government financial balance (% GDP) | -0.1 | -0.4 | -1.8 | -2.5 |
| Gross debt general government (% GDP) | 48.3 | 45.1 | 45.0 | 46.7 |
| Taxes and social security contributions (% GDP) | 38.1 | 38.6 | 38.1 | 38.0 |
| Gross government expenditure (% GDP) | 43.6 | 43.4 | 44.1 | 44.8 |
Contacts
Contacts