
Projections February 2025 (CEP 2025)
CPB projections: moderate growth in an uncertain world

On 26 February, CPB published the Central Economic Plan (CEP) presenting the prospects for the economy and public finances. These projections also include an outlook covering the period up to 2033. Geopolitical developments render the economic situation uncertain. Since the inauguration of the new US administration political decisions are becoming less predictable and possible disruptive changes in the areas of trade and international cooperation may occur. The current projections take only limited account of these heightened uncertainties.
CPB Director Pieter Hasekamp: “The government deficit is set to rise less than previously projected. At the same time, there is great geopolitical uncertainty and it is wise to leave sufficient headroom to absorb future setbacks, in line with the budget rules in the outline coalition agreement. The economic situation, with continued labour market tightness and relatively high inflation, also provides no basis for an expansionary budget policy.”
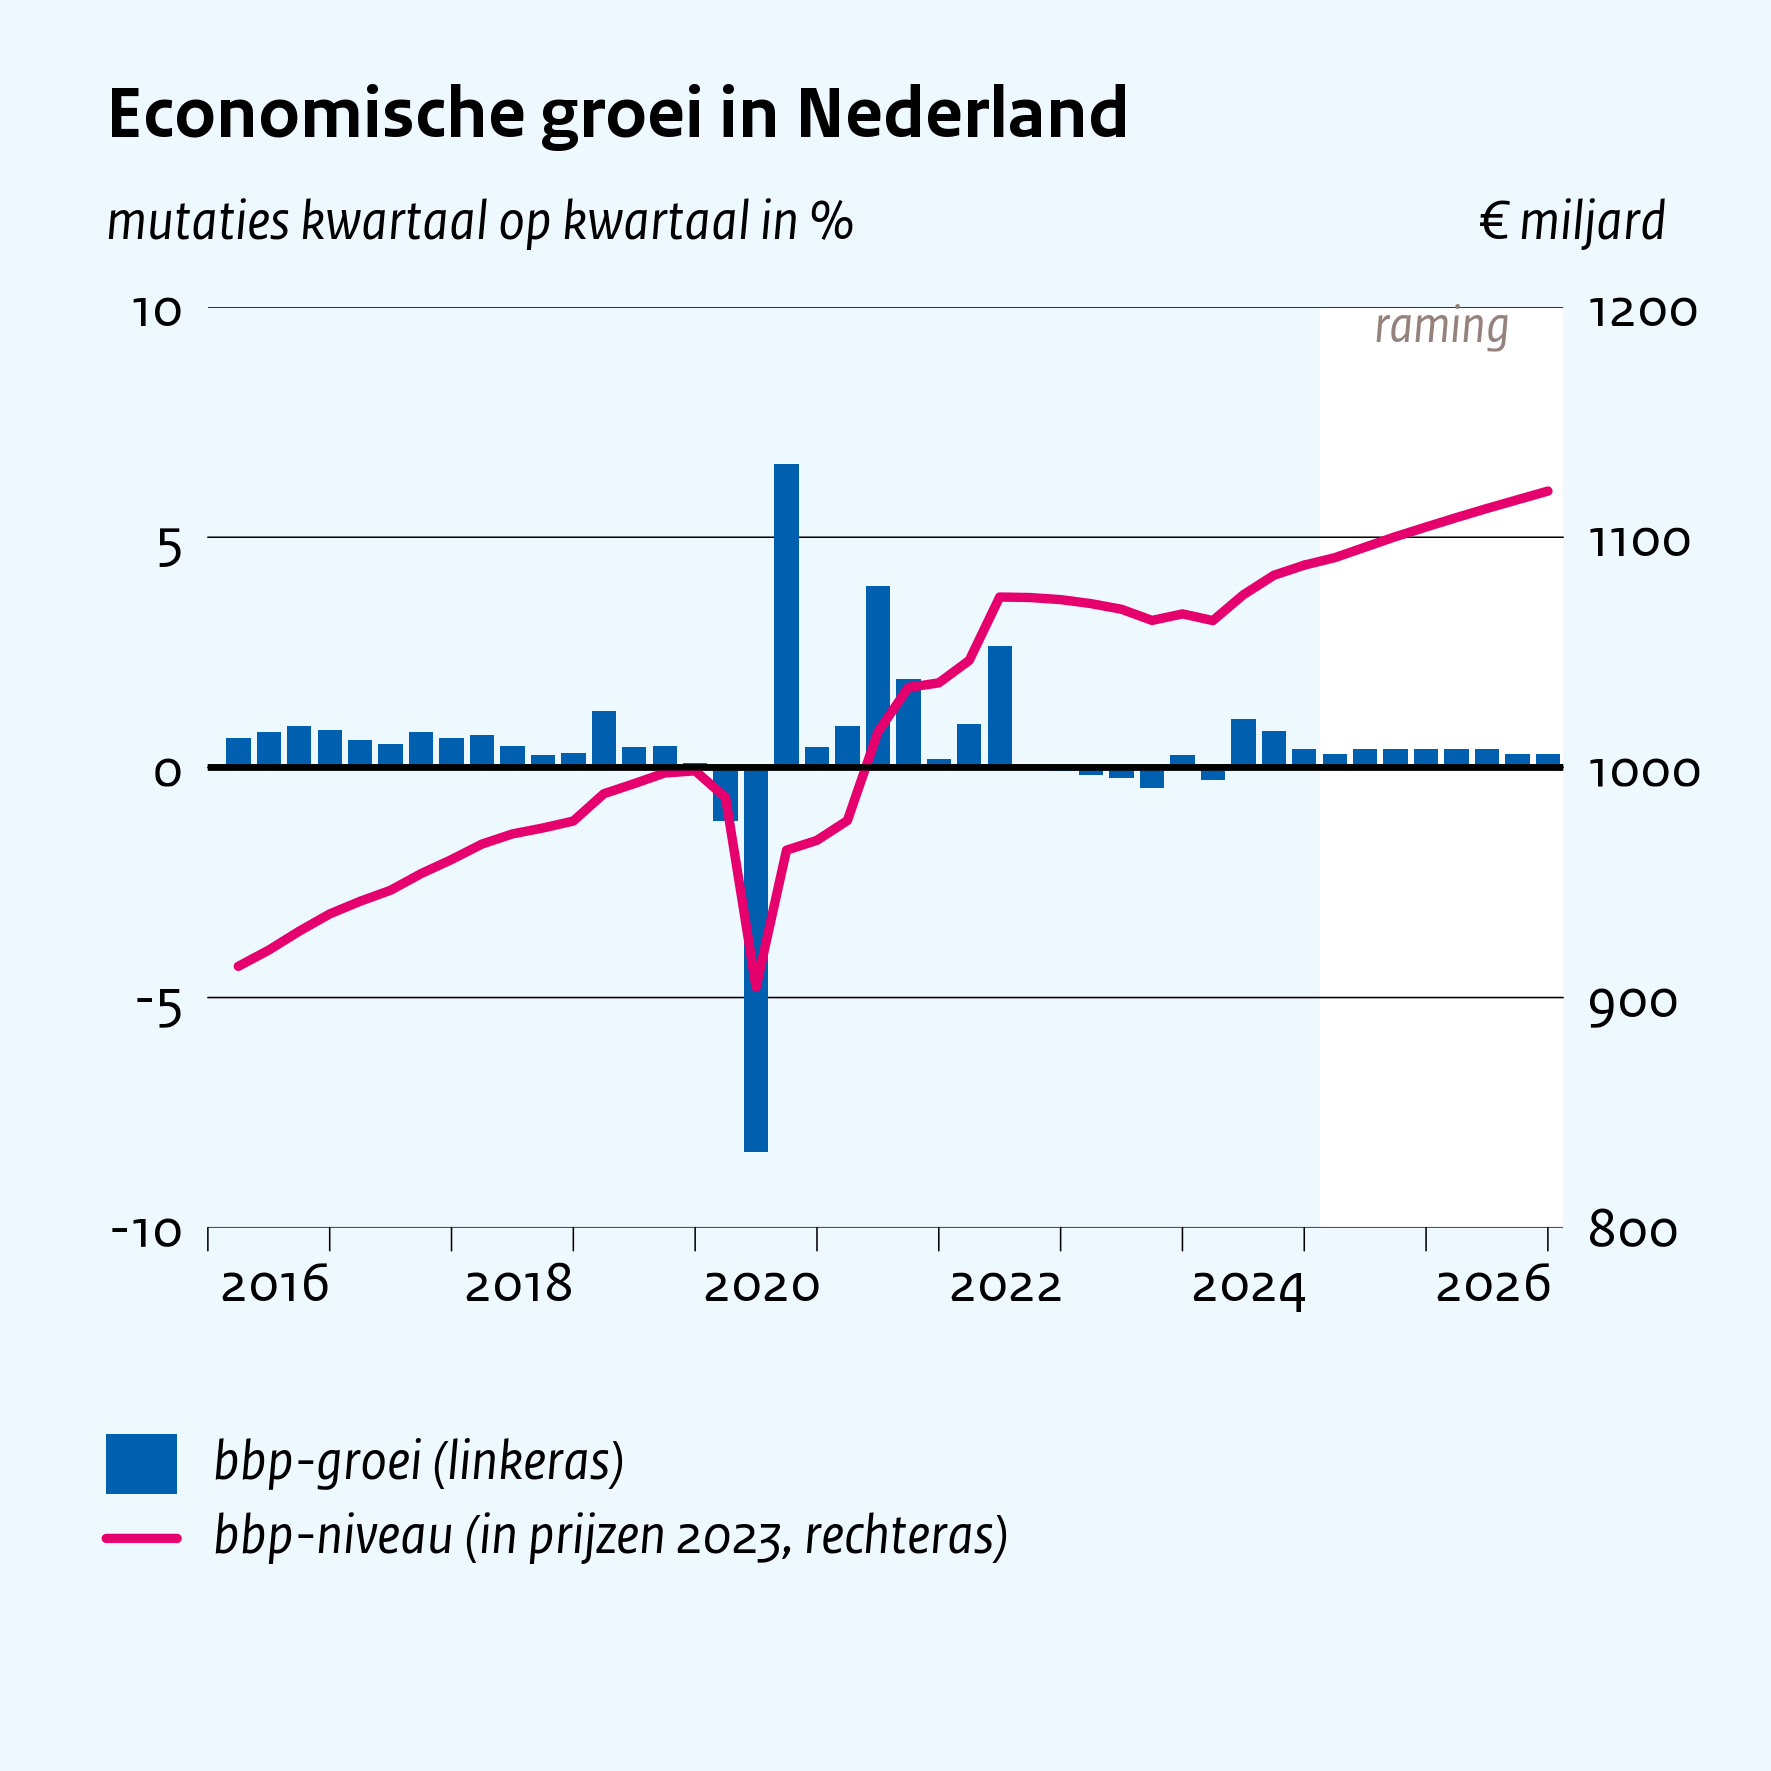
Moderate economic growth
GDP is set to grow by 1.9% in 2025 and 1.5% in 2026. Households and the government in particular are stimulating growth by spending more. In the medium term, the economy is set to grow more strongly than previously projected. The labour supply is higher because more young people and more seniors around the retirement age are working. Unemployment also remains lower. At the same time we expect productivity growth to remain low over this period.
Purchasing power and poverty
Purchasing power will grow in the coming years as wage growth outstrips inflation. Alleviation of the financial burden from the outline coalition agreement also contributes to the increase in purchasing power. This will also reduce poverty, from 3.5% in 2024 to 2.9% in 2026. Inflation is set to fall, but will remain above 2% for a number of years as wages continue to rise and policies such as the VAT increase take effect.
| 2024 | 2025 | 2026 | |
| GDP growth is picking up (in %, per year) | 0.9 | 1.9 | 1.5 |
| Unemployment remains low (% of the labour force) | 3.7 | 3.8 | 4.0 |
| Purchasing power increases (median, % per year) | 2.9 | 0.6 | 1.1 |
| Poverty lower due to wage growth and policy (persons, in %) | 3.5 | 3.2 | 2.9 |
| Government deficit deteriorates (in % GDP) | -0.6 | -1.8 | -2.4 |
Public finances
The government balance is set to deteriorate in the medium term as expenditure growth outpaces revenues, which stay more or less in line with GDP growth. This is mainly due to rising healthcare and social security costs (partly as a result of population ageing) and higher interest expenditure. The balance will be -1.7% of GDP in 2028 and -2.9% of GDP in 2033. With the working population significantly larger than previously projected, public finances are also set to develop more favourably.
Contacts

.
Downloads


Contacts


Dit blijkt uit het achtergronddocument ‘Structureel arbeidsaanbod in het CEP 2025’. Hierin analyseert het CPB de ontwikkeling van het arbeidsaanbod in de periode 2025-2033. De raming is gebaseerd op geschatte participatiegraden van mannen en vrouwen in verschillende leeftijdsgroepen en op de bevolkingsprognose van het Centraal Bureau voor de Statistiek (CBS). De raming ligt ten grondslag aan de middellangetermijnverkenning bij het CEP 2025. Vergeleken met de laatste middellangetermijnverkenning bij het CEP 2024 is het structurele arbeidsaanbod opwaarts aangepast. De aanpassing is het gevolg van geactualiseerde gegevens en een herschatting van het arbeidsaanbodmodel. In het achtergronddocument worden deze bewerkingen nader toegelicht.
Authors


Authors

Authors


De literatuur geeft aan dat er tussen de 1 en 2% van het bbp aan investeringen nodig is voor de energietransitie. Vanwege de onzekerheid die gepaard gaat met de energietransitie, gaat deze analyse uit van 1,5% van het bbp. Het is echter mogelijk dat niet alle investeringen in de energietransitie gerealiseerd zullen worden, zo ligt Nederland op dit moment nog niet op koers om de klimaatdoelen te halen. Hiervoor haalt het CPB 20% af van de benodigde investeringen in de energietransitie. Niet alle investeringen worden door bedrijven gedaan, ook huishoudens schaffen bijvoorbeeld zonnepanelen aan. Verder is het mogelijk dat een deel van die investeringen in de plaats komt van andere investeringen door bedrijven (verdringing). Het CPB gaat er op basis van literatuur en modelschattingen van uit dat dit geldt voor ongeveer een kwart van de investeringen in de energietransitie. In de raming voor de middellangetermijn komt het CPB er daarom op uit dat de totale private investeringen in Nederland met 0,9%-punt van productie marktsector toenemen vanwege de energietransitie.
Authors


Het CPB maakt periodiek een MLT-zorg als input voor de middellangetermijnraming van de Nederlandse economie op macroniveau en als basis voor de verdere zorgramingen in de komende kabinetsperiode.
Belangrijke oorzaken van de stijgende zorguitgaven zijn de demografische ontwikkeling en (in mindere mate) de inkomensgroei en de stijging van de relatieve inputprijs van zorg. Van de jaarlijkse reële groei van de totale zorguitgaven (3,1%) is ongeveer 40% toe te schrijven aan demografische ontwikkeling. Deze demografische groei volgt zowel uit veranderingen in de leeftijdssamenstelling als de omvang van de bevolking. Daarnaast is ruim 20% toe te wijzen aan de stijging van de reële lonen en prijzen in de zorg en ruim 15% aan inkomensgroei.
De jaarlijkse werkgelegenheidsgroei in de zorg bedraagt 2,1% in de periode 2027 - 2033. In een krappe arbeidsmarkt kan het een uitdaging zijn voor de zorgsector om in de MLT-periode voldoende personeel aan zich te binden en te behouden.
Authors


Downloads

Main economic indicators, 2023-2026, February 2025
| 2023 | 2024 | 2025 | 2026 | |
| Relevant world trade volume goods and services (%) | -0.6 | 0.6 | 2.4 | 2.4 |
| Export price competitors (goods and services, non-commodities, %) | -1.1 | 0.8 | 2.2 | 2.0 |
| Crude oil price (level in dollar per barrel) | 80.5 | 78.6 | 73.6 | 69.9 |
| Exchange rate (level in dollar per euro) | 1.08 | 1.08 | 1.03 | 1.03 |
| Long-term interest rate the Netherlands (level in %) | 2.8 | 2.6 | 2.7 | 2.7 |
| 2023 | 2024 | 2025 | 2026 | |
| Gross domestic product (GDP, economic growth, %) | 0.1 | 0.9 | 1.9 | 1.5 |
| Household consumption (%) | 0.8 | 1.0 | 2.6 | 2.4 |
| Government consumption (%) | 2.9 | 3.1 | 1.9 | 1.3 |
| Capital formation (including changes in stock, %) | -9.1 | -2.5 | 3.2 | 4.8 |
| Exports of goods and services (%) | -0.5 | 0.1 | 2.0 | 1.8 |
| Imports of goods and services (%) | -1.8 | -0.2 | 2.8 | 3.2 |
| 2023 | 2024 | 2025 | 2026 | |
| Price gross domestic product (%) | 7.3 | 5.1 | 3.6 | 2.7 |
| Export price goods and services (%) | -0.9 | 0.4 | 2.3 | 1.2 |
| Import price goods and services (%) | -3.4 | -1.4 | 1.7 | 0.8 |
| Inflation, national consumer price index (CPI, %) | 3.8 | 3.3 | 3.2 | 2.6 |
| Alternative CPI (purchasing power and poverty figures) (%) | 7.8 | 3.1 | 3.2 | 2.6 |
| Inflation, harmonised index of consumer prices (HICP, %) | 4.1 | 3.2 | 3.0 | 2.4 |
| Compensation per hour private sector (%) | 6.6 | 6.6 | 5.2 | 4.3 |
| Wages as determined in collective labour agreements, private sector (%) | 5.9 | 6.7 | 4.8 | 4.2 |
| Purchasing power, static, median all households (%) | -0.7 | 2.9 | 0.6 | 1.1 |
| People in poverty (level in %) (a) | 3.1 | 3.5 | 3.2 | 2.9 |
| 2023 | 2024 | 2025 | 2026 | |
| Labour force (%) | 2.0 | 0.9 | 0.5 | 0.8 |
| Active labour force (%) | 2.0 | 0.8 | 0.3 | 0.6 |
| Unemployment (in thousands of persons) | 359 | 373 | 390 | 415 |
| Unemployed rate (% of the labour force) | 3.6 | 3.7 | 3.8 | 4.0 |
| Employment (hours, %) | 1.4 | 0.6 | 0.3 | 0.3 |
| 2023 | 2024 | 2025 | 2026 | |
| Labour share in enterprise income private sector (level in %) | 67.6 | 68.2 | 67.9 | 68.6 |
| Labour productivity private sector (per hour, %) | -1.2 | 0.3 | 1.6 | 1.2 |
| Private savings (% of disposable household income) | 2.0 | 3.9 | 5.4 | 5.2 |
| Current-account balance (level in % GDP) | 9.9 | 10.6 | 10.4 | 9.5 |
| 2023 | 2024 | 2025 | 2026 | |
| General government financial balance (% GDP) | -0.4 | -0.6 | -1.8 | -2.4 |
| Gross debt general government (% GDP) | 45.2 | 43.6 | 44.5 | 47.2 |
| Taxes and social security contributions (% GDP) | 38.6 | 38.5 | 37.9 | 38.4 |
| Gross government expenditure (% GDP) | 43.4 | 43.5 | 44.0 | 45.2 |
(a) The new poverty line from CBS, SCP and Nibud has been used as poverty line.
Contacts