CPB Asset Liability Management Model for Pension Analyses
The ALM model is designed to answer these questions quantitatively. Though some of the policy variables the model considers are at the discretion of individual fund boards, the model analysis is confined to a representative pension fund for clarity.
The pension results of individual participants depend on demographic and financial developments. Pension benefits are higher if returns on savings perform well; high inflation rates make it costly to maintain the same purchasing power during retirement, as inflation erodes the real value of accumulated pension wealth. As a result of uncertainty in interest rates, stock returns and inflation, future benefit payments and purchasing power are also uncertain.
The ALM model was first designed to evaluate the effects of initial proposals of the Pension Agreement of 2013 (Lever, Mehlkopf and van Ewijk, 2012). The current version is specifically tailored to analyse proposed reforms to the Dutch solvency framework for pension funds which became effective in January 2015 (hereafter: ‘nFTK’), but can also handle more generic collective contracts, as well as individual contracts in which each age cohort has its own retirement account and in which there is no intergenerational risk sharing.
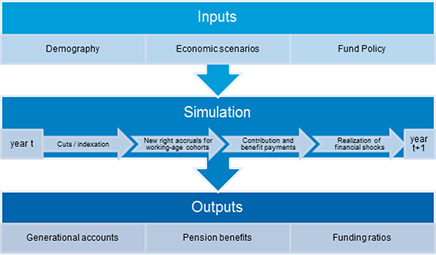
The ALM model shows how pension payments, contributions and other outcomes of interest develop for a range of economic and demographic scenarios, given the policy of the pension fund. It can return both average and median outcomes, as well as what happens in extreme scenarios. The model can also analyse whether proposed policy changes lead to ex-ante redistributions between generations in terms of market value (see Draper et al. 2014 for an application). Figure 1.1 provides a schematic overview of the model.
Figure 1.1

Section 2 describes the inputs that are used by the model. Section 3 discusses the simulation procedure and the key outcome variables. Section 4 contains an example using a hypothetical change in the Dutch nFTK. Section 5 concludes.
