
December 13, 2016
CPBs short-term forecasts December 2016
Economic growth will continue. For both this year and 2017, GDP is projected to grow by 2.1%. Next year, unemployment will decrease to 5.3% and the government budget will be balanced. Purchasing power will increase by 0.7%. The international situation, however, remains uncertain. The consequences of Brexit, for now, appear less severe than expected, but the economic and political situation in the European Union continues to be uncertain.
Main conclusions
Read the accompanying press release.
Fan Charts
Take a look at the Fan Charts.
Economic growth in the Netherlands, 2008-2017
>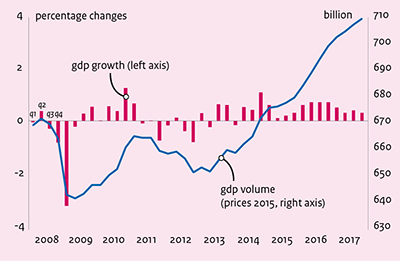
Table 'Main economic indicators', 2014-2017
| 2014 | 2015 | 2016 | 2017 | |
|---|---|---|---|---|
| Relevant world trade volume goods and services (%) |
4.1 |
4.0 |
2.7 |
2.9 |
| Export price competitors (goods and services, non-commodities, %) |
-0.7 |
6.4 |
-2.2 |
1.4 |
| Crude oil price (dollar per barrel) |
99.0 |
52.5 |
43.5 |
50.5 |
| Exchange rate (dollar per euro) |
1.33 |
1.11 |
1.11 |
1.10 |
| Long-term interest rate the Netherlands (level in %) |
1.5 |
0.7 |
0.3 |
0.3 |
| 2014 | 2015 | 2016 | 2017 | |
|---|---|---|---|---|
| Gross domestic product (GDP, economic growth, %) |
1.4 |
2.0 |
2.1 |
2.1 |
| Consumption households (%) |
0.3 |
1.8 |
1.6 |
2.1 |
| Consumption general government (%) |
0.3 |
0.2 |
1.2 |
0.8 |
| Capital formation including changes in stock (%) |
3.2 |
6.2 |
5.5 |
5.3 |
| Exports of goods and services (%) |
4.5 |
5.0 |
3.4 |
3.2 |
| Imports of goods and services (%) |
4.2 |
5.8 |
3.8 |
3.8 |
| 2014 | 2015 | 2016 | 2017 | |
|---|---|---|---|---|
| Price gross domestic product (%) |
0.1 |
0.1 |
0.7 |
1.2 |
| Export price goods and services (non-energy, %) |
-0.8 |
0.7 |
-2.2 |
1.1 |
| Import price goods (%) |
-2.7 |
-5.1 |
-6.3 |
1.2 |
| Inflation, harmonised index of consumer prices (hicp, %) |
0.3 |
0.2 |
0.1 |
0.9 |
| Contractual wages market sector (%) |
1.0 |
1.3 |
1.7 |
1.7 |
| Purchasing power, static, median, all households (%) |
1.3 |
1.1 |
2.7 |
0.7 |
| 2014 | 2015 | 2016 | 2017 | |
|---|---|---|---|---|
| Labour force (%) |
-0.4 |
0.4 |
0.4 |
0.8 |
| Active labour force (%) |
-0.6 |
1.0 |
1.3 |
1.5 |
| Unemployment (in thousands of persons) |
660 |
614 |
540 |
475 |
| Unemployed rate (% of the labour force) |
7.4 |
6.9 |
6.0 |
5.3 |
| 2014 | 2015 | 2016 | 2017 | |
|---|---|---|---|---|
| Production (%) |
2.4 |
2.8 |
2.7 |
2.7 |
| Labour productivity (hours, %) |
1.6 |
1.6 |
0.8 |
1.3 |
| Employment (hours, %) |
0.8 |
1.2 |
1.9 |
1.4 |
| Compensation per hour (%) |
0.8 |
0.2 |
2.2 |
2.6 |
| Labour share in enterprise income (level in %) |
78.7 |
77.1 |
77.8 |
78.0 |
| 2014 | 2015 | 2016 | 2017 | |
|---|---|---|---|---|
| Private savings (% of disposable household income) |
-1.4 |
0.2 |
1.8 |
0.8 |
| Current-account balance (level in % GDP) |
8.5 |
8.5 |
8.7 |
8.3 |
| 2014 | 2015 | 2016 | 2017 | |
|---|---|---|---|---|
| General government financial balance (% GDP) |
-2.3 |
-2.0 |
-0.5 |
0.0 |
| Gross debt general government (% GDP) |
67.9 |
65.1 |
62.7 |
59.7 |
| Taxes and social security contributions (% GDP) |
37.5 |
37.7 |
38.7 |
39.0 |
CPB uses as of CEP 2016 hours worked instead of FTE as standard for labour input. This has implications for the figures on wage rates and employment. A CPB Background Document with more information is available (only in Dutch).
Downloads

English, Pdf, 1.3 MB
English, Excel, 49.5 KB
English, Excel, 37.5 KB