
Forecast June 2017
The lights are green for the Dutch economy

The economy is projected to grow by 2.4% in 2017 and 2.0% in 2018, which compares favourably with the expected moderate structural growth. Consumer spending, investments and exports all contribute to this growth. Household consumption will benefit from an increase in disposable income. This increase is determined, particularly, by the increase in employment. Purchasing power is expected to increase, slightly, in both years. With regard to the rising investment levels, the housing market is still in the lead, and exports will profit from favourable international developments.
The stable economic growth will lead to addition employment. Unemployment thus is expected to decrease to 4.9% in 2017 and 4.7% in 2018. Government finances are healthy, with projected surpluses of 0.5% in 2017 and 0.7% in 2018. In combination with economic growth, this will result in a declining debt ratio, down to 55%.
The improving economy will not yet resonate in every sector. Contract wages will increase by a projected 1.7% in 2017 and 2.0% in 2018. This means they lag behind the favourable developments in economic growth and employment. This may be explained by the more flexible labour market. Inflation (HICP) also lags behind and is projected to come to 1.4%, in both years. The ECB’s purchasing policy appears to have only a limited impact on inflation.
The green lights for the Dutch economy may turn to yellow, if international uncertainties change into setbacks. Examples of such uncertainties within Europe include the results from the Brexit negotiations and the financial stability of certain southern European countries. Outside Europe, the course steered by the United States and China’s economic developments also remain important factors.
This forecast is published in CPB Policy Brief 2017/08 'Juniraming 2017' (only in Dutch).
Fan Charts June 2017
The figures present fan charts around the KMEV 2018 point forecasts for GDP growth, HICP inflation, unemployment and general government financial balance.
The solid line represents data realizations (2012-2016) and the KMEV 2018 point forecasts for 2017 and 2018. Around the central path the figures present a fan of confidence intervals:
- 30% confidence interval from the 35th to 65th percentile, dark blue area
- 60% confidence interval from the 20th to 80th percentile, dark blue + blue area
- 90% confidence interval from the 5th to 95th percentile, dark blue + blue + light blue area
The probability is thus 30% that the outcome will fall in the dark blue area and the probability is 10% that the outcome will fall outside the fan. In other words, the fan is a graphical representation of the likelihood of the various outcomes. The solid line represents the most likely outcome and outcomes are more likely when they are closer to the solid line.
Downloads

Authors

Economic growth in the Netherlands, 2008-2018
>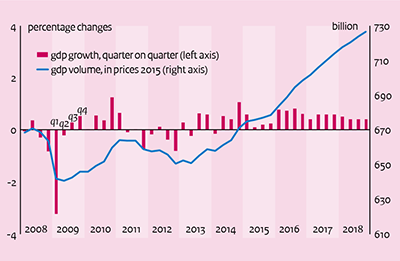
Table 'Main economic indicators', 2015-2018
| 2015 | 2016 | 2017 | 2018 | |
|---|---|---|---|---|
| Relevant world trade volume goods and services (%) |
3.8 |
2.9 |
3.8 |
4.0 |
| Export price competitors (goods and services, non-commodities, %) |
8.0 |
-3.1 |
0.9 |
1.3 |
| Crude oil price (dollar per barrel) |
51.9 |
43.3 |
50.8 |
50.6 |
| Exchange rate (dollar per euro) |
1.11 |
1.11 |
1.08 |
1.09 |
| Long-term interest rate the Netherlands (level in %) |
0.7 |
0.3 |
0.5 |
0.5 |
| 2015 | 2016 | 2017 | 2018 | |
|---|---|---|---|---|
| Gross domestic product (GDP, economic growth, %) |
2.0 |
2.2 |
2.4 |
2.0 |
| Consumption households (%) |
1.8 |
1.7 |
1.8 |
2.0 |
| Consumption general government (%) |
0.2 |
1.0 |
1.1 |
1.3 |
| Capital formation including changes in stock (%) |
6.2 |
5.4 |
5.5 |
2.7 |
| Exports of goods and services (%) |
5.0 |
3.4 |
3.9 |
4.1 |
| Imports of goods and services (%) |
5.8 |
3.7 |
4.2 |
4.3 |
| 2015 | 2016 | 2017 | 2018 | |
|---|---|---|---|---|
| Price gross domestic product (%) |
0.1 |
1.0 |
1.2 |
1.5 |
| Export price goods and services (non-energy, %) |
0.7 |
-0.7 |
0.8 |
1.1 |
| Import price goods (%) |
-5.1 |
-4.5 |
4.2 |
0.6 |
| Inflation, harmonised index of consumer prices (hicp, %) |
0.2 |
0.1 |
1.4 |
1.4 |
| Contractual wages market sector (%) |
1.3 |
1.5 |
1.7 |
2.0 |
| Purchasing power, static, median, all households (%) |
1.1 |
2.6 |
0.3 |
0.2 |
| 2015 | 2016 | 2017 | 2018 | |
|---|---|---|---|---|
| Labour force (%) |
0.4 |
0.4 |
0.9 |
1.1 |
| Active labour force (%) |
1.0 |
1.3 |
2.0 |
1.3 |
| Unemployment (in thousands of persons) |
614 |
538 |
444 |
427 |
| Unemployed rate (% of the labour force) |
6.9 |
6.0 |
4.9 |
4.7 |
| 2015 | 2016 | 2017 | 2018 | |
|---|---|---|---|---|
| Production (%) |
2.8 |
2.8 |
3.2 |
2.4 |
| Labour productivity (hours, %) |
1.6 |
0.2 |
0.6 |
1.2 |
| Employment (hours, %) |
1.2 |
2.6 |
2.5 |
1.1 |
| Compensation per hour (%) |
0.2 |
0.9 |
2.8 |
2.8 |
| Labour share in enterprise income (level in %) |
77.1 |
76.9 |
77.8 |
78.0 |
| 2015 | 2016 | 2017 | 2018 | |
|---|---|---|---|---|
| Private savings (% of disposable household income) |
0.2 |
-0.1 |
0.2 |
0.5 |
| Current-account balance (level in % GDP) |
8.5 |
7.7 |
7.2 |
7.1 |
| 2015 | 2016 | 2017 | 2018 | |
|---|---|---|---|---|
| General government financial balance (% GDP) |
-2.0 |
0.4 |
0.5 |
0.7 |
| Gross debt general government (% GDP) |
65.1 |
62.2 |
58.5 |
55.4 |
| Taxes and social security contributions (% GDP) |
37.7 |
39.0 |
39.3 |
39.2 |
Downloads

Contacts

Authors