
Forecast March 2019 (CEP 2019)
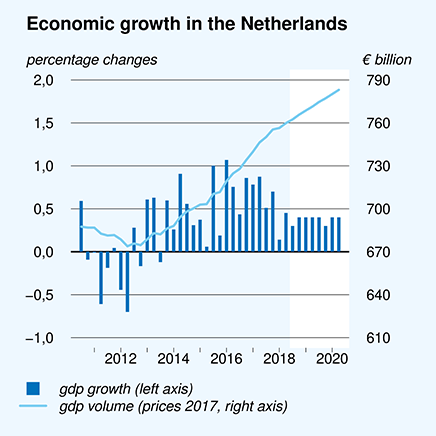
The high growth rate of the Dutch economy is over.

| Main data for the Dutch economy | 2018 | 2019 | 2020 |
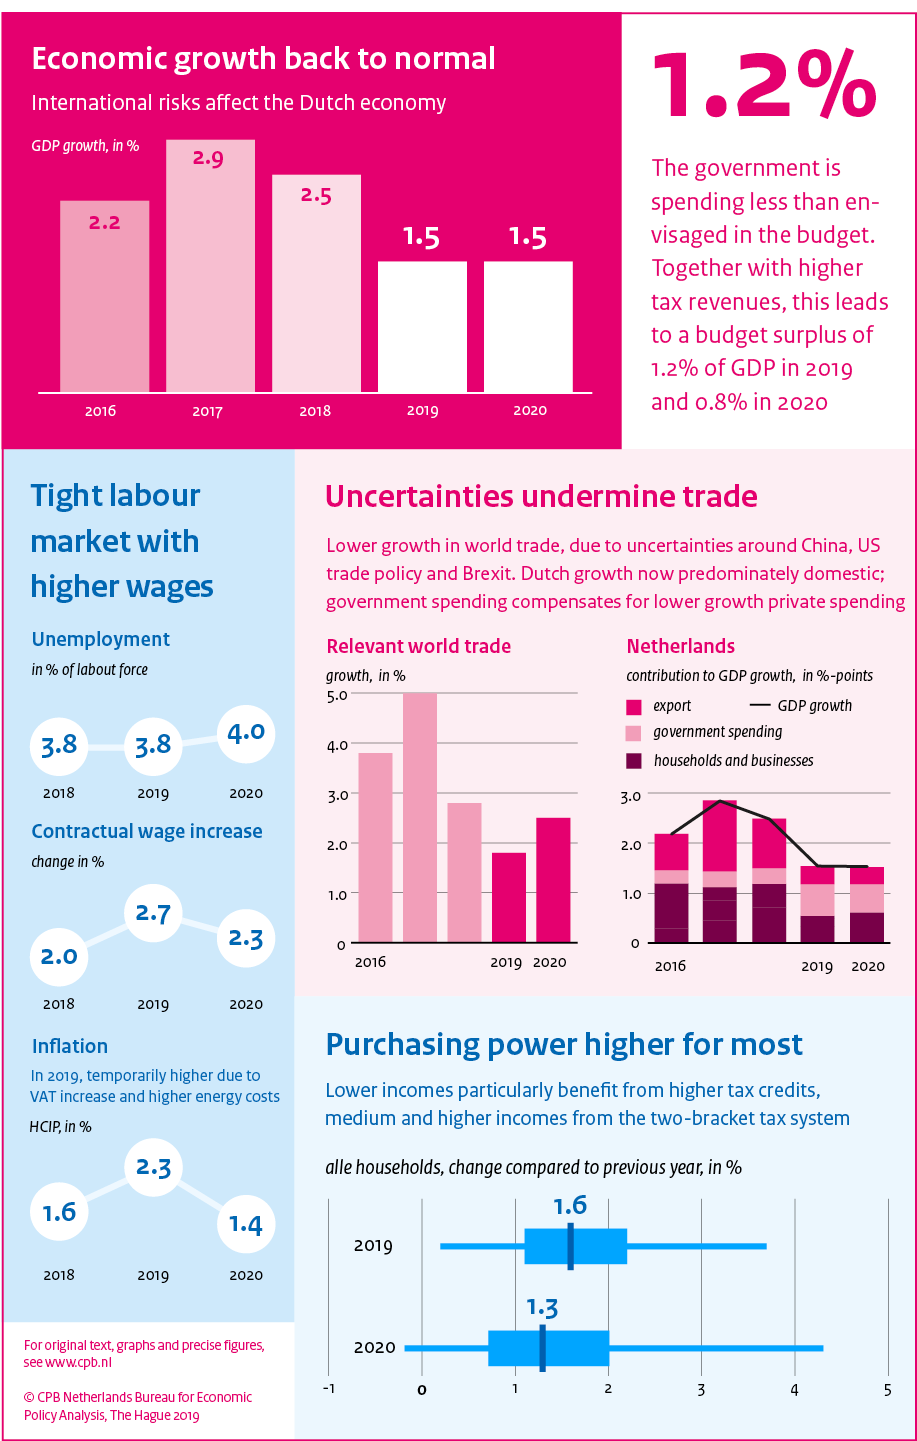
| GDP growth back to normal | 2.5 | 1.5 | 1.5 |
| Unemployment remains low | 3.8 | 3.8 | 4.0 |
| Higher inflation in 2019, due to higher VAT and energy taxes | 1.6 | 2.3 | 1.4 |
| Policy and higher wages are stimulating purchasing power | 0.3 | 1.6 | 1.3 |
| Budget surplus | 1.4 | 1.2 | 0.8 |
| Government debt continues to decrease | 52.4 | 49.1 | 47.1 |
Government spending will increase substantially, although less so than envisaged. Higher expenditures will contribute to the economic growth projected for 2019 and 2020. And yet, some planned increases in spending, particularly regarding defence and infrastructure, will not be realised, partly because of the tight labour market. This contributes to a larger budget surplus projected for both years.
In addition to the newest economic figures, CPB also points to the benefits of a stable budget policy in case of further economic decline. Lower educated people and those working in flexible employment relationships would be hit the hardest by such a decline. Structural reforms could limit the uncertainties for such vulnerable groups in society.
Downloads
")

Achtergrond
Het CPB maakt sinds jaar en dag ramingen van de ontwikkeling van de koopkracht van huishoudens. De jaarlijkse Macro Economische Verkenning van het CPB geeft een algemeen beeld van hoe de koopkracht zich het komende jaar zal ontwikkelen, gegeven de verwachtingen voor lonen en prijzen, en het voorgenomen beleid. In de doorrekeningen van verkiezingsprogramma’s en Regeerakkoorden kijkt het CPB ook verder vooruit en worden projecties gemaakt van de koopkrachtontwikkeling in de aankomende kabinetsperiode.
Sinds een aantal jaar maakt het CPB ook berekeningen van beleidseffecten op de inkomensverdeling op de lange termijn. Soms is sprake van beleidsmaatregelen die een geleidelijke transitie vergen, waardoor niet alleen effecten optreden op de korte of middellange termijn, maar ook effecten na de middellange termijn. In de doorrekeningen van verkiezingsprogramma’s en het Regeerakkoord maakt het CPB daarom ook ramingen van de structurele effecten op de inkomensverdeling van huishoudens. Als indicator voor inkomensongelijkheid wordt de Gini-coëfficiënt gehanteerd. Voordeel van de Gini-coëfficiënt is dat de ongelijkheid van de inkomensverdeling van huishoudens samengevat wordt in één getal dat goed te interpreteren is. Effecten van beleid kunnen zo vertaald worden in een mutatie van de inkomensongelijkheid.
Authors
Downloads

Table 'Main economic indicators', 2017-2020, 21 March 2019
| 2017 | 2018 | 2019 | 2020 | |
| Relevant world trade volume goods and services (%) | 5.0 | 2.8 | 1.8 | 2.5 |
| Export price competitors (goods and services, non-commodities, %) | 2.1 | 0.9 | 1.2 | 1.2 |
| Crude oil price (dollar per barrel) | 54.3 | 70.9 | 61.0 | 61.0 |
| Exchange rate (dollar per euro) | 1.13 | 1.18 | 1.14 | 1.14 |
| Long-term interest rate the Netherlands (level in %) | 0.5 | 0.6 | 0.4 | 0.6 |
| 2017 | 2018 | 2019 | 2020 | |
| Gross domestic product (GDP, economic growth, %) | 2.9 | 2.5 | 1.5 | 1.5 |
| Consumption households (%) | 1.9 | 2.5 | 1.3 | 1.5 |
| Consumption general government (%) | 1.1 | 1.1 | 2.4 | 2.3 |
| Capital formation including changes in stock (%) | 4.4 | 4.2 | 2.6 | 2.5 |
| Exports of goods and services (%) | 5.3 | 2.7 | 1.1 | 2.3 |
| Imports of goods and services (%) | 4.9 | 2.7 | 1.5 | 3.0 |
| 2017 | 2018 | 2019 | 2020 | |
| Price gross domestic product (%) | 1.2 | 2.1 | 2.2 | 1.4 |
| Export price goods and services (non-energy, %) | 1.9 | 0.8 | 1.1 | 1.1 |
| Import price goods (%) | 4.2 | 2.5 | -0.4 | 1.0 |
| Inflation, harmonised index of consumer prices (hicp, %) | 1.3 | 1.6 | 2.3 | 1.4 |
| Compensation per hour private sector (%) | 1.2 | 2.3 | 3.4 | 2.6 |
| Contractual wages private sector (%) | 1.6 | 2.0 | 2.7 | 2.3 |
| Purchasing power, static, median, all households (%) | 0.3 | 0.3 | 1.6 | 1.3 |
| 2017 | 2018 | 2019 | 2020 | |
| Labour force (%) | 0.8 | 1.2 | 1.3 | 0.7 |
| Active labour force (%) | 2.1 | 2.3 | 1.4 | 0.5 |
| Unemployment (in thousands of persons) | 438 | 350 | 345 | 370 |
| Unemployed rate (% of the labour force) | 4.9 | 3.8 | 3.8 | 4.0 |
| Employment (hours, %) | 1.9 | 2.3 | 1.0 | 0.5 |
| 2017 | 2018 | 2019 | 2020 | |
| Labour share in enterprise income (level in %) | 73.4 | 74.0 | 75.1 | 75.6 |
| Labour productivity private sector (per hour, %) | 0.9 | 0.3 | 0.6 | 1.2 |
| Private savings (% of disposable household income) | 2.9 | 2.3 | 2.6 | 2.9 |
| Current-account balance (level in % GDP) | 10.5 | 10.1 | 9.7 | 9.0 |
| 2017 | 2018 | 2019 | 2020 | |
| General government financial balance (% GDP) | 1.2 | 1.4 | 1.2 | 0.8 |
| Gross debt general government (% GDP) | 57.0 | 52.4 | 49.1 | 47.1 |
| Taxes and social security contributions (% GDP) | 38.7 | 39.1 | 39.6 | 39.3 |
| Gross government expenditure (% GDP) | 43.0 | 42.4 | 42.5 | 43.0 |