
December 14, 2010
CPBs short-term forecasts December 2010: Moderate growth in uncertain times
The Dutch economy is expected to grow by 1¾% in 2010. GDP growth will decrease slightly to 1½% during the coming year. According to the economic forecast, unemployment will decrease to 5% of the labour force on average in 2011. Inflation is forecast to be 1¼% this year and 1½% next year.
- Main Conclusions
- The table 'Extended main economic indicators'
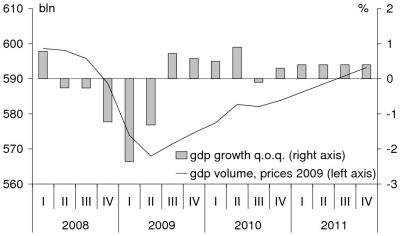
- Graph 'Economic growth in the Netherlands, 2008-2011'
- Related Publication
- Appendix: Main Economic Indicators for the Netherlands, 1970-2011
Main conclusions of CPB’s short-term forecasts December 2010
- The Dutch economy is expected to grow by 1¾% in 2010. Next year, GDP growth decelerates somewhat, to 1½%.
- The estimated average unemployment rate falls from 5½% of the labour force this year to 5% in 2011.
- The government budget defi cit will be 5.8% GDP this year and will decrease to 4.1% GDP in 2011.
- Inflation is expected to be moderate in both forecasting years: 1¼% and 1½% respectively. Contractual wage growth in the marketsector will come out at 1% this year and 1½% next year.
- The outlook is subject to high uncertainty, due to the ongoing turmoil on financial markets, among others.
Read here the accompanying press release.
The table 'Extended main economic indicators'
| 2008 | 2009 | 2010 | 2011 | |
|---|---|---|---|---|
| Relevant world trade volume (%) | 1.5 | -13.4 | 10 3/4 | 4 3/4 |
| Import price goods (%) | 4.6 | -7.5 | 6 1/2 | 1/2 |
| Export price competitors (%) | 3.8 | -3.1 | 4 1/4 | 3/4 |
| Crude oil price (Brent, $) | 96.9 | 61.5 | 79 | 84 |
| Exchange rate (dollar per euro) | 1.47 | 1.39 | 1.33 | 1.39 |
| Long-term interest rate (%) | 4.3 | 3.7 | 3 | 3 |
| 2008 | 2009 | 2010 | 2011 | |
|---|---|---|---|---|
| Gross domestic product (GDP, economic growth) (%) | 1.9 | -3.9 | 1 3/4 | 1 1/2 |
| Private consumption (%) | 1.1 | -2.5 | 1/4 | 3/4 |
| Public demand (%) | 3.0 | 4.0 | 1 1/4 | -1/2 |
| Gross fixed investment, private non-residential (%) | 7.1 | -18.2 | -3 3/4 | 2 3/4 |
| Exports of goods (non-energy) (%) | 1.2 | -9.2 | 12 3/4 | 6 1/4 |
| of which domestically produced (%) | -1.4 | -10.5 | 7 1/2 | 2 1/2 |
| re-exports (%) | 3.8 | -7.9 | 17 3/4 | 9 1/4 |
| Imports of goods (%) | 3.3 | -10.3 | 12 1/2 | 5 |
| Value gross domestic product (GDP) (bln euro) | 596.2 | 572.0 | 590 | 607 |
| 2008 | 2009 | 2010 | 2011 | |
|---|---|---|---|---|
| Export price goods (excluding energy) (%) | 2.1 | -5.3 | 3 3/4 | 1/4 |
| Price competitiveness (%) | -0.2 | 4.1 | -1 3/4 | 1/4 |
| Consumer prices (CPI) (%) | 2.5 | 1.2 | 1 1/4 | 1 1/2 |
| Consumer prices (harmonised, HICP) (%) | 2.2 | 1.0 | 1 | 1 1/2 |
| Price of gross domestic product (%) | 2.4 | -0.2 | 1 1/2 | 1 1/2 |
| Price of national expenditure (%) | 2.1 | 0.9 | 1 1/4 | 1 1/2 |
| Contractual wages market sector (%) | 3.5 | 2.7 | 1 | 1 1/2 |
| Compensation per full-time employee market sector (%) | 3.5 | 2.0 | 2 | 3 1/4 |
| Gross wage Jones family (in euro's) | 31500 | 32500 | 32500 | 32500 |
| Purchasing power (Jones, one-income household) (%) | -0.5 | 1.9 | -1 1/4 | -1/2 |
| Purchasing power (median, all households) (%) | 0.1 | 1.8 | -1/4 | -1/4 |
| 2008 | 2009 | 2010 | 2011 | |
|---|---|---|---|---|
| Population (x 1000 pers.) | 16446 | 16530 | 16615 | 16680 |
| Labour force (15-64) (x 1000 pers.) | 7801 | 7846 | 7815 | 7845 |
| Employed labour force (15-64) (x 1000 pers.) | 7501 | 7469 | 7390 | 7445 |
| Unemployment (x 1000 pers.) | 300 | 377 | 425 | 400 |
| Labour force (15-64) (%) | 1.9 | 0.6 | -1/2 | 1/4 |
| Employed labour force (15-64) (%) | 2.6 | -0.4 | -1 | 3/4 |
| Unemployment rate (%) | 3.8 | 4.8 | 5 1/2 | 5 |
| Idem, international definition (%) | 3.1 | 3.7 | 4 1/2 | 4 1/4 |
| 2008 | 2009 | 2010 | 2011 | |
|---|---|---|---|---|
| Production (%) | 1.7 | -5.4 | 1 1/4 | 2 |
| Labour productivity (%) | 0.5 | -3.1 | 3 1/2 | 1 1/2 |
| Employment (labour years) (%) | 1.2 | -2.4 | -2 1/4 | 1/2 |
| Price gross value added (%) | 0.7 | 2.6 | 2 | 1/2 |
| Real labour costs (%) | 2.8 | -0.6 | 0 | 3 |
| Labour share in enterprise income (level in %) | 79.0 | 80.9 | 77 3/4 | 78 1/2 |
| Profit share (of domestic production) (level in %) | 13.8 | 7.7 | 10 | 10 1/4 |
| 2008 | 2009 | 2010 | 2011 | |
|---|---|---|---|---|
| General government financial balance (% GDP) | 0.6 | -5.4 | -5.8 | -4.1 |
| Gross debt general government (% GDP) | 58.2 | 60.8 | 64.6 | 66.9 |
| Taxes and social security contributions (% GDP) | 39.1 | 38.2 | 38.2 | 38.8 |
Economic growth in the Netherlands, 2008-2011
Related publication
Downloads
English, Excel, 44.5 KB