
CPBs short-term forecasts December 2012
The economy is shrinking, budget deficit to 3.3% in 2013
Go straight to the data.
Since the first quarter of 2011, the Dutch economy has shrunk during four of the six quarters and hardly grew in the remaining two. In actual fact, it has been shrinking for the past 18 months and is not projected to recover even slightly before the second half of 2013. This according to the December projections for the Dutch economy for the years 2012 and 2013, published today by the CPB Netherlands Bureau for Economic Policy Analysis (CPB Policy Brief 2012/07, (only in Dutch)).
The Dutch economy has been estimated to have shrunk by 1% in 2012, and for 2013 a decline of ½% is projected. This will cause unemployment to rise to 6% in 2013. General government finances are also affected by the shrinking economy. This year’s EMU deficit is expected to come to 3.8% of GDP, and for 2013 to 3.3%. Thus, despite the considerably weakened economy, the EMU balance will improve, as a result of sizeable spending cuts and increases in financial burden.
The downward adjustment to the projected EMU balance for 2013 from the projections in CPB’s Macro Economic Outlook (MEV) 2013, published last September, is fully due to the lower growth projection and accompanying lower tax revenues.
The eurozone is in recession, with an expected economic downturn of ½% for 2012 and ¼% for 2013. Despite several measures to increase the structural strength, the performance of the Dutch economy is disappointing when set against that of other countries in the eurozone. On the positive side, European financial markets seem to have entered calmer waters.
- Main Conclusions
- The table 'Extended main economic indicators', 2010-2013
- Graph 'Economic growth in the Netherlands, 2008-2013'
- Related Publication 'CPB Policy Brief 2012/07 (only in Dutch)'
- Appendix: Main Economic Indicators for the Netherlands, 1970-2013
- Appendix: Key data for the world economy and external data for the Netherlands, 1975-2012
Main conclusions
Read the accompanying press release.
Table 'Extended main economic indicators', 2010-2013
| 2010 | 2011 | 2012 | 2013 | |
|---|---|---|---|---|
| Relevant world trade (vol. %) | 11.3 | 4.0 | 1/4 | 2 1/2 |
| Import price goods (%) | 7.3 | 4.9 | 2 3/4 | -3/4 |
| Export price competitors (%) | 7.9 | 6.3 | 2 3/4 | -1/2 |
| Crude oil price (Brent, $) | 79.5 | 111.3 | 112 | 112 |
| Exchange rate (dollar p euro) | 1.33 | 1.39 | 1.29 | 1.30 |
| Long-term interest rate (level in %) | 3.0 | 2.9 | 2.0 | 2.2 |
| 2010 | 2011 | 2012 | 2013 | |
|---|---|---|---|---|
| Gross domestic product (GDP, economic growth) (%) | 1.6 | 1.0 | -1 | -1/2 |
| Value gross domestic product (GDP) (bln euro) | 588.7 | 602.0 | 604 | 609 |
| Private consumption (%) | 0.3 | -1.0 | -1 1/2 | -1 1/2 |
| Public demand (%) | 0.3 | -0.6 | -1 | -1/4 |
| Gross fixed investment, private non-residential (%) | -5.2 | 10.2 | -3 1/4 | -3 |
| Exports of goods (non-energy) (%) | 13.5 | 4.3 | 2 1/2 | 3 |
| of which domestically produced (%) | 9.7 | 3.8 | -1 3/4 | 1 3/4 |
| re-exports (%) | 17.0 | 4.7 | 6 1/4 | 4 |
| Imports of goods (%) | 12.2 | 4.1 | 2 | 1 3/4 |
| 2010 | 2011 | 2012 | 2013 | |
|---|---|---|---|---|
| Export price goods (excluding energy) (%) | 4.3 | 1.4 | 1/4 | -1 |
| Price competitiveness (%) | 2.3 | 0.8 | 2 1/2 | 1 |
| Consumer prices (CPI) (%) | 1.3 | 2.3 | 2 1/2 | 2 3/4 |
| Consumer prices (harmonised, HICP) (%) | 0.9 | 2.5 | 2 3/4 | 2 3/4 |
| Price of gross domestic product (%) | 1.1 | 1.2 | 1 1/4 | 1 1/2 |
| Price of national expenditure (%) | 1.2 | 0.8 | 2 | 2 |
| Contractual wages market sector (%) | 1.0 | 1.4 | 1 3/4 | 2 |
| Compensation per full-time employee market sector (%) | 1.7 | 2.1 | 3 1/4 | 2 1/2 |
| Gross wage Jones family (in euro's) | 32500 | 33000 | 33000 | 33000 |
| Purchasing power (Jones, one-income household) (%) | -1.2 | -1.2 | -2 1/4 | -1 1/2 |
| Purchasing power (median, all households) (%) | -0.5 | -0.9 | -2 | -1 1/4 |
| 2010 | 2011 | 2012 | 2013 | |
|---|---|---|---|---|
| Population (x 1000 pers.) | 16615 | 16693 | 16755 | 16820 |
| Labour force (15-74) (x 1000 pers.) | 8748 | 8746 | 8880 | 8935 |
| Employed labour force (15-74) (x 1000 pers.) | 8358 | 8357 | 8410 | 8410 |
| Unemployment (x 1000 pers.) | 390 | 389 | 470 | 525 |
| Employed Persons (15-74) (%) | -0.4 | 0.7 | -1/4 | -1/2 |
| Labour force (15-74) (%) | -0.3 | 0.0 | 1 1/2 | 3/4 |
| Employed labour force (15-74) (%) | -1.0 | 0.0 | 3/4 | 0 |
| Unemployment rate (% labour force) | 4.5 | 4.4 | 5 1/4 | 6 |
| Idem, national definition (% labour force) | 5.4 | 5.4 | 6 1/2 | 7 1/4 |
| 2010 | 2011 | 2012 | 2013 | |
|---|---|---|---|---|
| Production (%) | 1.1 | 1.4 | -2 | -1/2 |
| Labour productivity (%) | 2.9 | 1.0 | -1 1/2 | 1 |
| Employment (labour years) (%) | -1.8 | 0.4 | -1/2 | -1 1/2 |
| Price gross value added (%) | 2.0 | 0.3 | 1 1/4 | -1/4 |
| Real labour costs (%) | -0.3 | 1.8 | 2 | 2 3/4 |
| Labour share in enterprise income (level in %) | 78.7 | 78.7 | 81 3/4 | 83 1/4 |
| 2010 | 2011 | 2012 | 2013 | |
|---|---|---|---|---|
| General government financial balance (% GDP) | -5.1 | -4.5 | -3.8 | -3.3 |
| Gross debt general government (% GDP) | 63.1 | 65.5 | 71.0 | 72.9 |
| Taxes and social security contributions (% GDP) | 38.8 | 38.4 | 38.9 | 40.1 |
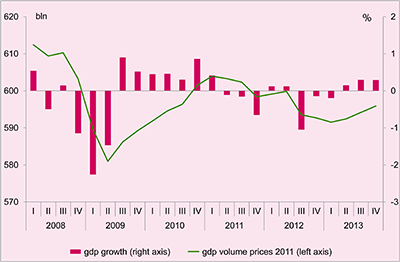
Economic growth in the Netherlands, 2008-2013
Related publication
Downloads
