
CPBs short-term forecasts December 2013
Slight growth 2014 will not yet lead to additional consumption

Go straight to the data.
This according to the December projections published today by the CPB Netherlands Bureau for Economic Policy Analysis. Compared to the last projections published in September changes are only small.
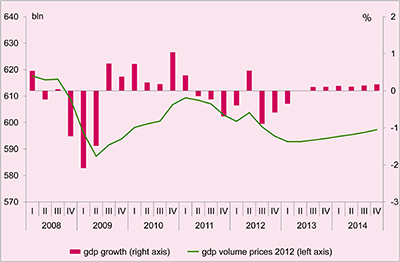
The slight growth in GDP (gross domestic product) of 0.1% in the third quarter of 2013 is expected to continue next year. Annual growth is projected to be ½% for 2014. This is particularly due to increases in exports and investments. Consumer spending next year will continue to decline further, mainly as an after-effect of the income reduction of 2013 and the decline in wealth of the past years. The average increase in contract wages in 2014 is expected to equal inflation. Purchasing power is projected to increase next year, due to a lowering of the tax rate of the first tax bracket, a drop in health insurance premiums and lower pension fund contributions for civil servants.
Labour market recovery is not on the cards yet. Unemployment in 2014 will continue to rise and, on average, will involve 7½% of the working population. There will be no turn around yet, as employment is projected to decline also in 2014, albeit at a slower pace than in 2013. The decline for next year is estimated at ½% in the market sector and 1½% in the public sector. At the same time, there will be an increase in the number of people who would like to enter the labour market, although this increase will be smaller than in 2013.
Inflation in 2014 will even out at 1½%. The main factors contributing to a rise in consumer prices are the relatively large rent increases and price increases of imported consumer goods and services. As in the rest of the eurozone, inflation in the Netherlands also will be lower than in 2013, partly because the October 2012 increase in VAT will no longer affect inflation.
The EMU balance will even out at 3.1% in 2013 and 3.3% in 2014. The deficit will be attenuated by sizeable spending cuts and burden increases that were decided on in the government agreements of both Rutte Cabinets, the Government Agreement 2013 (Spring Agreement), and the six-billion-euro package of measures of last autumn. The increase in the expenditure on health care is lower than projected earlier. This has enabled a reduction in health care premiums, but has little influence on the EMU balance.
- Main Conclusions
- The table 'Extended main economic indicators', 2011-2014
- Graph 'Economic growth in the Netherlands, 2008-2014'
- Related Publication
- Appendix: Main Economic Indicators for the Netherlands, 1970-2014
- Appendix: Key data for the world economy and external data for the Netherlands, 1975-2014
Main conclusions
Read the accompanying press release.
Table 'Extended main economic indicators', 2011-2014 (17 dec 2013)
| 2011 | 2012 | 2013 | 2014 | |
|---|---|---|---|---|
| Relevant world trade (vol. %) | 4.0 | 0.7 | 1 1/2 | 3 3/4 |
| Import price goods (%) | 5.1 | 2.7 | -1 1/2 | -3/4 |
| Export price competitors (%) | 6.3 | 4.1 | -1 1/2 | -1/2 |
| Crude oil price (Brent, $) | 111.3 | 111.7 | 109 | 109 |
| Exchange rate (dollar p euro) | 1.39 | 1.28 | 1.33 | 1.36 |
| Long-term interest rate (level in %) | 3.0 | 1.9 | 2.0 | 2.4 |
| 2011 | 2012 | 2013 | 2014 | |
|---|---|---|---|---|
| Gross domestic product (GDP, economic growth) (%) | 0.9 | -1.2 | -1 | 1/2 |
| Value gross domestic product (GDP) (bln euro) | 599.0 | 599.3 | 603 | 611 |
| Private consumption (%) | -1.1 | -1.6 | -2 | -3/4 |
| Public demand (%) | -0.6 | -0.8 | -1 1/4 | 1/2 |
| Gross fixed investment, private non-residential (%) | 12.3 | -2.9 | -6 1/4 | 4 |
| Exports of goods (non-energy) (%) | 4.4 | 1.9 | 1/2 | 4 |
| of which domestically produced (%) | 3.8 | 0.7 | -3/4 | 2 3/4 |
| re-exports (%) | 4.9 | 3.0 | 1 3/4 | 5 1/4 |
| Imports of goods (%) | 4.7 | 3.6 | -3/4 | 3 1/2 |
| 2011 | 2012 | 2013 | 2014 | |
|---|---|---|---|---|
| Export price goods (excluding energy) (%) | 2.1 | 0.8 | 0 | -1/2 |
| Price competitiveness (%) | -0.2 | 2.4 | -3 1/4 | -1/4 |
| Consumer prices (CPI) (%) | 2.3 | 2.5 | 2 1/2 | 1 1/2 |
| Consumer prices (harmonised, HICP) (%) | 2.5 | 2.8 | 2 1/2 | 1 1/4 |
| Price of gross domestic product (%) | 1.1 | 1.3 | 1 3/4 | 3/4 |
| Price of national expenditure (%) | 0.7 | 1.8 | 1 1/2 | 1 |
| Contractual wages market sector (%) | 1.4 | 1.6 | 1 1/2 | 1 1/2 |
| Compensation per full-time employee market sector (%) | 1.9 | 1.7 | 1 1/2 | 3 |
| Gross wage Jones family (in euro's) | 33500 | 33000 | 32500 | 33500 |
| Purchasing power (median, all households) (%) | -1.0 | -2.4 | -1 | 1 |
| 2011 | 2012 | 2013 | 2014 | |
|---|---|---|---|---|
| Population (x 1000 pers.) | 16693 | 16754 | 16795 | 16840 |
| Labour force (15-74) (x 1000 pers.) | 8746 | 8878 | 8950 | 8980 |
| Employed labour force (15-74) (x 1000 pers.) | 8357 | 8409 | 8345 | 8320 |
| Unemployment (x 1000 pers.) | 389 | 469 | 605 | 665 |
| Employed Persons (15-74) (%) | 0.7 | -0.2 | -1 | -1/2 |
| Labour force (15-74) (%) | 0.0 | 1.5 | 3/4 | 1/4 |
| Employed labour force (15-74) (%) | 0.0 | 0.6 | -3/4 | -1/4 |
| Unemployment rate (% labour force) | 4.4 | 5.3 | 6 3/4 | 7 1/2 |
| Idem, national definition (% labour force) | 5.4 | 6.4 | 8 1/2 | 9 |
| 2011 | 2012 | 2013 | 2014 | |
|---|---|---|---|---|
| Production (%) | 1.4 | -1.9 | -1 3/4 | 3/4 |
| Labour productivity (%) | 0.9 | -1.7 | -3/4 | 1 1/4 |
| Employment (labour years) (%) | 0.5 | -0.2 | -1 | -1/2 |
| Price gross value added (%) | 0.3 | 1.7 | 1 1/4 | 3/4 |
| Real labour costs (%) | 1.6 | 0.0 | 1/4 | 2 1/4 |
| Labour share in enterprise income (level in %) | 79.0 | 80.5 | 81 | 82 |
| 2011 | 2012 | 2013 | 2014 | |
|---|---|---|---|---|
| General government financial balance (% GDP) | -4.3 | -4.1 | -3.1 | -3.3 |
| Gross debt general government (% GDP) | 65.7 | 71.3 | 74.6 | 75.6 |
| Taxes and social security contributions (% GDP) | 38.6 | 39.0 | 39.6 | 40.6 |
Economic growth in the Netherlands, 2008-2014
Related publication
Downloads
