
CPBs short-term forecasts December 2014
Low euro exchange rate and oil price contribute to recovery
These are the conclusions of CPB Netherlands Bureau for Economic Policy Analysis in its December projections for 2014 and 2015, published today.
Go straight to the data.
In recent months, the value of the euro has declined by 7% compared to that of the US dollar. In addition, oil prices have dropped by 30%. Both developments are favourable for the Dutch economy. Exports profit from the improvement in the country's competitive position and consumption levels are growing, in part due to lower energy prices. The economic growth is stimulating employment opportunities in the business sector. In contrast, employment in both the public sector and the healthcare sector is projected to decline in 2015, while the labour force is increasing. On balance, this will result in a slight decrease in unemployment, from 6¾% in 2014 to 6½% next year.
Inflation will remain low, in part as a result of decreasing oil prices. For both this year and the next, inflation is projected to be 1%. Over the past months, there has been considerable public debate on the consequences of low inflation, or deflation. The risk of deflation cannot be separated from low economic growth, and carries the added effect of increasing both household and government debt. However, low inflation is also favourable for wealthy households as well as for the purchasing power of all households.
The EMU deficit in 2014 will come to 2.8%, taking into account the back payment to the EU of 0.2% over 2014. For 2015, the EMU deficit is projected to improve to 1.8%. Factors with a positive impact in this respect are the higher economic growth, lower unemployment and ongoing spending cuts (compared to planned expenditures) particularly in healthcare. On the opposite side is the lower natural gas income. The structural EMU balance is estimated at -0.5% of GDP for both 2014 and 2015 and, thereby, equals the medium-term objective.
Contacts

- Main Conclusions
- The table 'Main economic indicators', 2012-2015
- Graph 'Economic growth in the Netherlands, 2008-2015'
- Related Publication
- Appendices (all available this time!)
Main conclusions
Read the accompanying press release.
Table 'Main economic indicators', 2012-2015
| 2012 | 2013 | 2014 | 2015 | |
|---|---|---|---|---|
| Relevant world trade volume (%) |
0.7 |
1.7 |
2 3/4 |
4 |
| Export price competitors (%) |
4.1 |
-2.1 |
-1 3/4 |
1 |
| Crude oil price (Brent, level in dollars per barrel) |
111.7 |
108.7 |
100 |
77 |
| Exchange rate (dollar per euro) |
1.28 |
1.33 |
1.33 |
1.24 |
| Long-term interest rate the Netherlands (level in %) |
1.9 |
2.0 |
1.5 |
1.2 |
| 2012 | 2013 | 2014 | 2015 | |
|---|---|---|---|---|
| Gross domestic product (GDP, economic growth, %) |
-1.6 |
-0.7 |
3/4 |
1 1/2 |
| Consumption households (%) |
-1.4 |
-1.6 |
0 |
1 1/4 |
| Consumption general government (%) |
-1.6 |
-0.2 |
-1/4 |
0 |
| Capital formation including changes in stock (%) |
-5.8 |
-4.9 |
2 1/2 |
3 1/4 |
| Exports of goods and services (%) |
3.3 |
2.0 |
4 1/4 |
4 1/2 |
| Imports of goods and services (%) |
2.8 |
0.8 |
4 1/4 |
4 3/4 |
| 2012 | 2013 | 2014 | 2015 | |
|---|---|---|---|---|
| Price gross domestic product (%) |
1.3 |
1.0 |
1 |
1/2 |
| Export price domestically produced goods (non energy, %) |
1.5 |
0.0 |
-1 3/4 |
-1 |
| Import price goods (%) |
3.4 |
-1.5 |
-3 1/2 |
-1 3/4 |
| National consumer price index (CPI, %) |
2.5 |
2.5 |
1 |
1 |
| Contractual wages market sector (%) |
1.6 |
1.2 |
1 |
1 1/4 |
| Purchasing power, static, median all households (%) |
-2.0 |
-1.3 |
1 1/4 |
3/4 |
| 2012 | 2013 | 2014 | 2015 | |
|---|---|---|---|---|
| Labour force (%) |
1.5 |
0.8 |
-1/2 |
1/2 |
| Active labour force (%) |
0.6 |
-0.7 |
-3/4 |
1 |
| Unemployment (in thousands of persons) |
469 |
600 |
605 |
570 |
| Unemployed rate (% of the labour force) |
5.3 |
6.7 |
6 3/4 |
6 1/2 |
| 2012 | 2013 | 2014 | 2015 | |
|---|---|---|---|---|
| Production (%) |
-1.8 |
-0.9 |
1 3/4 |
2 |
| Labour productivity (labour years, %) |
-1.2 |
0.6 |
1 3/4 |
1 1/4 |
| Employment (labour years, %) |
-0.6 |
-1.5 |
0 |
3/4 |
| Compensation per employee (%) |
2.3 |
2.6 |
1 3/4 |
1/2 |
| Labour share in enterprise income (level in %) |
79.5 |
81.4 |
80 1/2 |
79 1/4 |
| 2012 | 2013 | 2014 | 2015 | |
|---|---|---|---|---|
| Private savings (% of disposable household income) |
0.0 |
0.6 |
2 1/2 |
2 1/4 |
| Current-account balance (level in % GDP) |
8.8 |
8.5 |
8 3/4 |
9 |
| 2012 | 2013 | 2014 | 2015 | |
|---|---|---|---|---|
| General government financial balance (% GDP) |
-4.0 |
-2.3 |
-2.8 |
-1.8 |
| Gross debt general government (% GDP) |
66.5 |
68.6 |
69.2 |
69.6 |
| Taxes and social security contributions (% GDP) |
36.3 |
37.2 |
37.8 |
37.8 |
Both the wage-rate market sector, labour-income share and the private savings are biased upward for 2014 and 2015, due to the measure to limit the use of a so-called Stamrecht bv (severance pay insurance fund). Severance payments will be paid directly to the person involved, instead of into such a fund. After the revision of the National Accounts, severance payments are registered as employers' social security contributions. This translates into a non-recurring increase of the wage rate in 2014 which affects the development of the wages in the private sector well over 0.5% points.
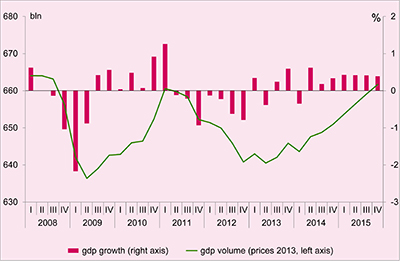
Economic growth in the Netherlands, 2008-2015
Related publication
Downloads

Contacts