Central Economic Plan 2011
Modest economic growth

Modest economic growth
According to the Central Economic Plan 2011, published by CPB Netherlands Bureau for Economic Policy Analysis today, the Dutch economy is projected to grow by 1¾% and 1½% in 2011 and 2012, respectively. These modest growth figures are not sufficient to catch up on the loss in growth sustained during the past recession. The economic growth is largely due to exports. Household consumption and business investments are also contributing factors. The labour market continues to exhibit positive trends: unemployment is projected to further decline to an average of 4% in 2012. Due to the higher inflation of 2% in 2011 and 2012, and due to policy measures, average purchasing power will decline in both forecast years. The forecasted budget deficit is declining rapidly from 5.2% of the gross domestic product (GDP) in 2010 to 2.2% of the GDP next year.
Major uncertainties
The final estimate of this Central Economic Plan was completed at the beginning of March. This means that the most recent developments in, for example, Japan, have not been included in the figures. Even if this had been possible, it would probably have been difficult at this time to estimate the effects on the development of the Dutch economy. Tentative estimates were produced on the basis of alternative scenarios, however, to account for the effects of higher oil prices, a worldwide recovery of consumer and producer confidence and a more expensive euro.
| 2010 | 2011 | 2012 | |
|---|---|---|---|
| Relevant world trade volume (%) | 11.3 | 6 1/4 | 5 |
Gross domestic product (GDP, %) | 1.7 | 1 3/4 | 1 1/2 |
| Private consumption (%) | 0.4 | 3/4 | 1 |
| Gross fixed investment, private non-residential (%) | -1.6 | 4 | 4 3/4 |
| Exports of goods, non-energy (%) | 12.7 | 7 1/4 | 5 1/4 |
| Consumer prices (CPI, %) | 1.3 | 2 | 2 |
| Contractual wages market sector (%) | 1.0 | 1 3/4 | 2 1/2 |
| Purchasing power, median, all households (%) | -0.4 | -3/4 | -3/4 |
| Unemployment rate (% labour force) | 4.5 | 4 1/4 | 4 |
| Employment (labour years, %) | -1.8 | 3/4 | 1/2 |
| General government financial balance (% GDP) | -5.2 | -3.7 | -2.2 |
Sharp worldwide difference in growth
The world economy is recovering from the crisis. However, economic performance varies sharply from one country to another. The GDP of emerging economies in Asia last year increased by 9.0%. Growth figures in the United States (2.8%) and the euro region (1.7%) lagged far behind. The emerging economies are projected to continue to do relatively well in the forecast years as well. The national debt as a percentage of GDP increased sharply in highly developed economies and governments are faced with the task of getting their government finances in order. This will reduce economic growth in the coming years. The growth of the relevant world trade, in which the highly developed economies carry a lot of weight, is consequently slowing down from over 11% in 2010 to 6¼% this year and 5% next year.
The Dutch economy
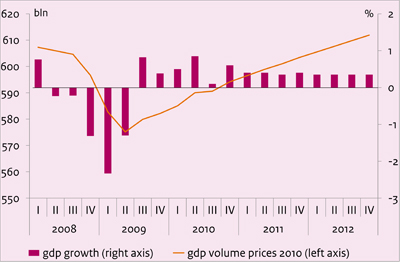
According to the provisional figures published by Statistics Netherlands, the economy grew by a 0.6% (quarter-on-quarter) in the fourth quarter of 2010. The growth rate is projected to decline somewhat in the next few quarters, resulting in an annual GDP growth of 1¾% this year and 1½% in 2012. The sharp decline in production during the Great Recession and the modest forecasted and actual growth since that time imply that the production peak experienced at the beginning of 2008 will only be equaled by the middle of next year. Roughly speaking, the Netherlands has therefore lost four years in economic growth due to the credit crisis.
Export supports GDP growth
Exports follow the global trade pattern: following strong growth in 2010, the pace is slowing in the forecast years. Nonetheless, exports in 2011 and 2012 will continue to account for the major share in economic growth.
The anticipated increase in household consumption will remain modest, especially because employment is only increasing to a limited extent and purchasing power is falling. Business investments, after two years of contraction, are projected to once again exhibit growth. Particularly investments in machinery, computers and means of transport are recovering. Due to the fact that existing production capacity is still not yet being fully exploited, replacement investments are probably playing a major role.
Government spending is resulting in the lowest accumulated contribution to growth over the three-year period 2010 -2012, since this figure was first measured in 1970. A steady growth in healthcare expenditures is offset by a decline in the public sector's consumption of and investment in goods and services, and a contraction in public sector employment.
Labour market quickly tightening
Starting with this Central Economic Plan, the CPB-Netherlands Bureau for Economic Policy Analysis is using the international definition of employment and unemployment in describing the labour market. The key difference with the national definition is that the international definition is based on the one-hour limit: anyone working at least one hour per week is counted as part of the labour force. The national definition by contrast is based on a twelve-hour limit. The transition to the international definition therefore means that people with small jobs are from now on counted as members of the labour force. The CPB-Netherlands Bureau for Economic Policy Analysis will continue to publish a number of labour market statistics based on both definitions for some time.
According to the international definition, unemployment is projected to decrease from an average of 4½% of the labour force in 2010 to 4% (355,000 persons) in 2012. In light of the significant contraction of production in recent years, the rise of unemployment to an annual peak of 4½% is better than anticipated. The labour market is once again beginning to tighten.
Median purchasing power declines three year in a row
Purchasing power is declining by ¾%, in part due to various policy measures. In addition, the increase in contract wages in the private sector (1¾%) is lagging inflation (2%) in 2011, while pensions are not or only partially being indexed. In 2012the median purchasing power is projected to decrease by ¾% as well. Since median purchasing power also decreased in 2010, this is the first time since the eighties that purchasing power is declining three years in a row.
Government finances are improving at a rapid pace
The budget deficit is expected to decrease from 5.2% of the GDP in 2010 to 2.2% of the GDP in 2012. This brings it down to below the 3% Maastricht ceiling already one year earlier than anticipated. The reduction in the budget deficit in 2011 and 2012 is related to the continued economic recovery and the restrictive fiscal policy, that is, the expiration of the stimulus package and the deficit reducing measures of the previous, as well as the current cabinet. The deficits are causing EMU debt to continue to rise up to 65.9% of the GDP in 2012.
Related publications:
CPB Policy Brief 2011/03 'The Netherlands and the European debt crisis'
CPBs short-term forecasts March/April 2011: Modest economic growth
The Central Economic Plan 2011, ISBN 9789012573306, can be ordered from April 5, 2011 at:
Sdu Service Centre Publishers (www.sdu.nl)
P.O. Box 20014
2500 EA The Hague
The Netherlands
Telephone : +31-70-3789880
Price: 33 euro
Read the accompanying press release.
Related publications:
CPB's short-term forecasts March/April 2011: Modest economic growth
CPB Policy Brief 2011/03 'The Netherlands and the European debt crisis'
The Central Economic Plan 2011, ISBN 9789012573306, can be ordered from April 5, 2011 at:
Sdu Service Centre Publishers (www.sdu.nl)
P.O. Box 20014
2500 EA The Hague
The Netherlands
Telephone : +31-70-3789880
Price: 33 euro
Downloads

The Netherlands and the European debt crisis
Will the troubled countries be able to fully repay their debt? Policy institutions remain confident, but the premiums to insure the government debts of these countries show that the financial markets do not share this assessment. Certainly with respect to Greece, there is a risk that the country will not be able to fully repay its debt. If Greece’s level of debt is indeed too high to redeem, continuing to require full redemption will be detrimental to the Netherlands, as this would negatively affect its growth perspectives. This will decrease the amount of debt repaid. Reducing the debt will prevent this and will therefore benefit all parties.
Who will pay the bill of such a debt decrease: the original creditors or the governments of the Euro area (and thus ultimately their tax payers)? As soon as it is clear that a troubled country is unable to fulfil its obligations, a decision on this issue is required. The longer this decision is postponed, the higher the proportion of the original debt re-financed by the emergency fund will become. Consequently, the proportion paid by the creditors will be lower, and the portion of the bill eventually presented to the governments of the other Euro area countries will increase. It will prove difficult to charge the creditors, however, as these largely consist of banks, insurers and pension funds. It is unclear whether all European banks will be able to bear such a loss. Also, there is a fear that restructuring will lead to a European banking crisis. For this reason, the European banking sector must become healthy again and a mechanism enabling the restructuring of government debts must be established.
This CPB Policy brief is also published as a Dutch-version.
Related publication:
Central Economic Plan 2011
Downloads

Authors
Arbeidskosten per eenheid product (CEP 2011)
We are sorry, unfortunately there is no English translation of this page.
Authors
Aspecten winstgevendheid bedrijven (CEP 2011)
We are sorry, unfortunately there is no English translation of this page.
Authors
Presentatie "Centraal Economisch Plan 2011"
We are sorry, unfortunately there is no English translation of this page.
CPBs short-term forecasts March/April 2011: Modest economic growth
- Main Conclusions
- The table 'Extended main economic indicators'
- Graph 'Economic growth in the Netherlands, 2008-2012'
- Related Publications
- Appendix: Main Economic Indicators for the Netherlands, 1970-2012
- Appendix: Main indicators labour market (E7), 1969-2012
Main conclusions
Read the accompanying press release.
The table 'Extended main economic indicators'
| 2009 | 2010 | 2011 | 2012 | |
|---|---|---|---|---|
| Relevant world trade (vol. %) | -13.7 | 11.3 | 6 1/4 | 5 |
| Import price goods (%) | -7.5 | 6.9 | 4 3/4 | 1/4 |
| Export price competitors (%) | -2.9 | 5.2 | 3 1/4 | 3/4 |
| Crude oil price (Brent, $) | 61.5 | 79.5 | 97 | 97 |
| Exchange rate (dollar per euro) | 1.39 | 1.33 | 1.34 | 1.34 |
| Long-term interest rate (level in %) | 3.7 | 3.0 | 3 1/2 | 4 |
| 2009 | 2010 | 2011 | 2012 | |
|---|---|---|---|---|
| Gross domestic product (GDP, economic growth) (%) | -3.9 | 1.7 | 1 3/4 | 1 1/2 |
| Value gross domestic product (GDP) (bln euro) | 572.0 | 590.1 | 610 | 632 |
| Private consumption (%) | -2.5 | 0.4 | 3/4 | 1 |
| Public demand (%) | 4.0 | 0.9 | 0 | -1/2 |
| Gross fixed investment, private non-residential (%) | -18.2 | -1.6 | 4 | 4 3/4 |
| Exports of goods (non-energy) (%) | -9.2 | 12.7 | 7 1/4 | 5 1/4 |
| of which domestically produced (%) | -10.5 | 7.2 | 3 1/4 | 3 |
| re-exports (%) | -7.9 | 17.7 | 10 3/4 | 7 |
| Imports of goods (%) | -10.3 | 12.1 | 6 1/4 | 4 1/2 |
| 2009 | 2010 | 2011 | 2012 | |
|---|---|---|---|---|
| Export price goods (excluding energy) (%) | -5.3 | 4.1 | 1 1/2 | 0 |
| Price competitiveness (%) | 4.3 | -0.8 | 0 | 1 |
| Consumer prices (CPI) (%) | 1.2 | 1.3 | 2 | 2 |
| Consumer prices (harmonised, HICP) (%) | 1.0 | 0.9 | 2 | 2 |
| Price of gross domestic product (%) | -0.2 | 1.4 | 1 1/2 | 2 1/4 |
| Price of national expenditure (%) | 0.9 | 1.3 | 1 3/4 | 2 1/2 |
| Contractual wages market sector (%) | 2.7 | 1.0 | 1 3/4 | 2 1/2 |
| Compensation per full-time employee market sector (%) | 2.0 | 1.7 | 3 1/4 | 3 1/2 |
| Gross wage Jones family (in euro's) | 32500 | 32500 | 32500 | 33000 |
| Purchasing power (Jones, one-income household) (%) | 1.9 | -1.3 | -1 | -2 1/4 |
| Purchasing power (median, all households) (%) | 1.8 | -0.4 | -3/4 | -3/4 |
| 2009 | 2010 | 2011 | 2012 | |
|---|---|---|---|---|
| Population (x 1000 pers.) | 16530 | 16615 | 16695 | 16770 |
| Labour force (15-74) (x 1000 pers.) | 8772 | 8748 | 8800 | 8870 |
| Employed labour force (15-74) (x 1000 pers.) | 8445 | 8358 | 8435 | 8515 |
| Unemployment (x 1000 pers.) | 327 | 390 | 365 | 355 |
| Labour force (15-74) (%) | 0.7 | -0.3 | 1/2 | 3/4 |
| Employed labour force (15-74) (%) | 0.1 | -1.0 | 1 | 1 |
| Unemployment rate (% labour force) | 3.7 | 4.5 | 4 1/4 | 4 |
| Idem, national definition (% labour force) | 4.8 | 5.4 | 5 | 4 3/4 |
| 2009 | 2010 | 2011 | 2012 | |
|---|---|---|---|---|
| Production (%) | -5.4 | 1.6 | 2 1/4 | 1 3/4 |
| Labour productivity (%) | -3.1 | 3.5 | 1 1/2 | 1 1/4 |
| Employment (labour years) (%) | -2.4 | -1.8 | 3/4 | 1/2 |
| Price gross value added (%) | 2.6 | 1.6 | 1/4 | 3/4 |
| Real labour costs (%) | -0.6 | 0.0 | 3 | 2 3/4 |
| Labour share in enterprise income (level in %) | 80.9 | 78.4 | 79 1/4 | 80 1/4 |
| Profit share (of domestic production) (level in %) | 7.7 | 9.4 | 10 1/2 | 10 1/4 |
| 2009 | 2010 | 2011 | 2012 | |
|---|---|---|---|---|
| General government financial balance (% GDP) | -5.4 | -5.2 | -3.7 | -2.2 |
| Gross debt general government (% GDP) | 60.8 | 63.7 | 65.5 | 65.9 |
| Taxes and social security contributions (% GDP) | 38.2 | 38.6 | 39.0 | 39.6 |
Economic growth in the Netherlands, 2008-2012