
Central Economic Plan (CEP) 2012
CPB: moderate economic recovery after 2012

This is published today in the publication Central Economic Plan 2012 (in Dutch).
Through a number of small adjustments, amounting to a total of EUR 200 million, the rounded-off budget deficit (EMU balance) for 2013 is forecast to be 4.6 percent of gross domestic product (GDP), one tenth percent higher when compared to the draft figures published on 1 March 2012.
The current economic recession will continue until the second half of this year; and GDP is expected to shrink by ¾ of a percent in 2012. A slight recovery is forecast for the following years: a growth in GDP of 1¼ percent in 2013, and of 1½ percent in both 2014 and 2015. During this period, median purchasing power will decline and unemployment will rise, peaking at 545,000 in 2013; while the national debt (EMU deficit) is forecast to rise to 76% of GDP in 2015. However, the cautious recovery of world trade and the positive trend visible in the German economy offers the Dutch export market a glimmer of hope. Despite this, the size of the economy is not expected to exceed that of the first quarter of 2008 until 2014. Not since the Second World War has the Netherlands experienced a six year period in which there has, on balance, been no growth of the economy.
In addition to potential budgetary adjustments in the Netherlands, the factor causing the greatest uncertainty is the development of the European debt crisis. In the last few months, Europe has been teetering on the edge of a financial abyss. Currently, the situation appears slightly more stable, primarily due to the intervention of the European Central Bank; by means of its Longer Term Refinancing Operations (LTRO) banks can borrow money cheaply from the ECB. However, this has not solved the underlying problem of the weak European financial sector, a problem which could impact negatively on the real economy.
Related:
Read the accompanying press release.
Related publications:
- CPB publication CEP 2012 (in Dutch)
- CPB's short-term forecasts March 2012: moderate economic recovery after 2012
The Central Economic Plan 2012, ISBN 978-90-1257-6-444, can be ordered from April 2, 2012 at:
Sdu Service Centre Publishers (www.sdu.nl)
P.O. Box 20014
2500 EA The Hague
The Netherlands
Telephone : +31-70-3789880
Price: 35 euro
Downloads
")
Herziening van de WWB-raming voor het Centraal Economisch Plan 2012
We are sorry, unfortunately there is no English translation of this page.
Authors
Presentatie "Centraal Economisch Plan 2012"
We are sorry, unfortunately there is no English translation of this page.
CPBs short-term forecasts March 2012: moderate economic recovery after 2012
- Main Conclusions
- The table 'Extended main economic indicators', 2011-2015
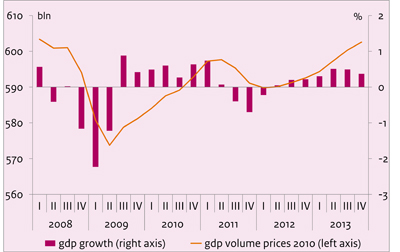
- Graph 'Economic growth in the Netherlands, 2008-2013'
- Related Publication
- Appendix: Main Economic Indicators for the Netherlands, 1970-2013
- Appendix: Main indicators labour market (E7), 1969-2013
Main conclusions
Read the accompanying press release (CEP 2012).
Table 'Extended main economic indicators', 2011-2015
| 2011 | 2012 | 2013 | 2014 | 2015 | |
|---|---|---|---|---|---|
| Relevant world trade (vol. %) | 4.0 | -1 3/4 | 4 1/2 | 6 | 6 |
| Import price goods (%) | 5.5 | 2 1/2 | 1/4 | 0 | -1/4 |
| Export price competitors (%) | 5.8 | 3 1/2 | -1/4 | 1/2 | 1/2 |
| Crude oil price (Brent, $) | 111.3 | 111 | 111 | 111 | 111 |
| Exchange rate (dollar p euro) | 1.39 | 1.29 | 1.29 | 1.29 | 1.29 |
| Long-term interest rate (level in %) | 2.9 | 2.3 | 2.7 | 3.0 | 3.3 |
| 2011 | 2012 | 2013 | 2014 | 2015 | |
|---|---|---|---|---|---|
| Gross domestic product (GDP, economic growth) (%) | 1.2 | -3/4 | 1 1/4 | 1 1/2 | 1 1/2 |
| Value gross domestic product (GDP) (bln euro) | 603.6 | 609 | 627 | 647 | 669 |
| Private consumption (%) | -0.9 | -1/2 | 1/2 | 1/2 | 1/4 |
| Public demand (%) | 0.6 | -1 | 0 | -1/4 | -1/4 |
| Gross fixed investment, private non-residential (%) | 7.2 | -3 1/4 | 7 1/2 | 6 3/4 | 5 1/2 |
| Exports of goods (non-energy) (%) | 4.3 | -1 3/4 | 3 3/4 | 6 1/4 | 6 3/4 |
| of which domestically produced (%) | 1.8 | -1/2 | 3 1/2 | 4 | 4 |
| re-exports (%) | 6.3 | -3 | 4 | 8 1/4 | 9 1/4 |
| Imports of goods (%) | 3.7 | -1 3/4 | 3 1/4 | 5 | 5 3/4 |
| 2011 | 2012 | 2013 | 2014 | 2015 | |
|---|---|---|---|---|---|
| Export price goods (excluding energy) (%) | 1.7 | 1/2 | 1/4 | -1/4 | -1/4 |
| Price competitiveness (%) | -0.7 | 2 1/4 | -3/4 | 0 | 0 |
| Consumer prices (CPI) (%) | 2.3 | 2 1/4 | 1 3/4 | 2 | 2 1/4 |
| Consumer prices (harmonised, HICP) (%) | 2.5 | 2 1/4 | 1 1/2 | 1 3/4 | 2 |
| Price of gross domestic product (%) | 1.4 | 1 3/4 | 1 1/2 | 1 3/4 | 1 3/4 |
| Price of national expenditure (%) | 1.2 | 2 1/4 | 1 3/4 | 1 3/4 | 2 |
| Contractual wages market sector (%) | 1.4 | 1 3/4 | 1 1/2 | 2 | 2 1/4 |
| Compensation per full-time employee market sector (%) | 2.5 | 3 1/4 | 1 1/2 | 2 1/2 | 2 1/2 |
| Gross wage Jones family (in euro's) | 33000 | 33000 | 33000 | 34000 | 34500 |
| Purchasing power (Jones, one-income household) (%) | -1.4 | -2 1/4 | -1/2 | -1 1/2 | -2 |
| Purchasing power (median, all households) (%) | -1.0 | -1 3/4 | 0 | -1/2 | -1/2 |
| 2011 | 2012 | 2013 | 2014 | 2015 | |
|---|---|---|---|---|---|
| Population (x 1000 pers.) | 16690 | 16765 | 16835 | 16835 | 16835 |
| Labour force (15-74) (x 1000 pers.) | 8746 | 8890 | 8915 | 8915 | 8930 |
| Employed labour force (15-74) (x 1000 pers.) | 8357 | 8395 | 8370 | 8375 | 8435 |
| Unemployment (x 1000 pers.) | 389 | 500 | 545 | 535 | 495 |
| Employed Persons (15-74) (%) | -0.3 | -1/4 | 0 | 1/4 | 3/4 |
| Labour force (15-74) (%) | 0.0 | 1 3/4 | 1/4 | 0 | 1/4 |
| Employed labour force (15-74) (%) | 0.0 | 1/2 | -1/4 | 0 | 3/4 |
| Unemployment rate (% labour force) | 4.5 | 5 1/2 | 6 | 6 | 5 1/2 |
| Idem, national definition (% labour force) | 5.4 | 6 3/4 | 7 1/4 | 7 1/4 | 6 1/2 |
| 2011 | 2012 | 2013 | 2014 | 2015 | |
|---|---|---|---|---|---|
| Production (%) | 1.8 | -1 1/2 | 1 3/4 | 2 | 2 |
| Labour productivity (%) | 1.5 | -3/4 | 2 1/2 | 2 1/4 | 1 1/4 |
| Employment (labour years) (%) | 0.2 | -3/4 | -3/4 | 0 | 1/2 |
| Price gross value added (%) | 0.5 | 3/4 | 1 | 1 | 1/2 |
| Real labour costs (%) | 2.0 | 2 1/4 | 1/4 | 1 1/2 | 2 |
| Labour share in enterprise income (level in %) | 78.6 | 81 1/2 | 79 1/4 | 78 1/2 | 79 |
| 2011 | 2012 | 2013 | 2014 | 2015 | |
|---|---|---|---|---|---|
| General government financial balance (% GDP) | -5.0 | -4.6 | -4.6 | -4.1 | -3.3 |
| Gross debt general government (% GDP) | 65.6 | 70.2 | 73.0 | 75.0 | 76.0 |
| Taxes and social security contributions (% GDP) | 38.2 | 38.8 | 38.6 | 39.0 | 39.3 |
Economic growth in the Netherlands, 2008-2013
Related publication
Downloads
