
Macro Economic Outlook (MEV) 2015
CPB: economic recovery remains fragile, purchasing power is increasing
The small increases in economic growth projected for 2015 are partly due to increased household consumption and a rise in business investments. However, as in previous years, export is expected to be the largest contributor to GDP growth in 2015. For next year, a modest increase in employment is projected with a slight decrease in unemployment, down to 6¾%. Inflation will remain low with 1% this year and 1¼% next year. The government deficit in 2014 will come to 2.6% and will decline next year to 2.2% of GDP. This decline is mostly due to deficit-reducing measures implemented in health care and public administration. Government debt, however, is expected to increase further, to 70.2% of GDP by 2015.
An increase in median purchasing power (1½%) is projected, following four years of decline. Next year, median household purchasing power will improve by ½%. To aid interpretation of the traditional ‘scatter diagrams’ showing purchasing power, CPB introduces three lines in the six illustrations it normally provides. The centre line represents median purchasing power per income level, and an upper and lower line represent the upper and lower limits of the purchasing power of 90% of households at a certain income level.
The main negative uncertainties concern foreign countries. Geopolitical tensions in various places around the world pose a risk to the global economy. A further escalation of the Ukrainian conflict could cause Dutch GDP growth to be ¼% to ½% lower. The current projections have assumed that further escalation is not to be the case and that relevant world trade will come out at 2½% this year and 4½% the next.
The Macro Economic Outlook 2015 also pays attention to abolishing the system of the so-called average pension premium. This would make the pension system more efficient and better equipped to deal with a changing labour market. The costs of such a transition are put in perspective and are shown to be certainly no greater than those of the past abolition of the Dutch early retirement scheme (VUT).
Go directly to the data.
Read the accompanying press release or the complete publication in Dutch.
Related:
Short-term forecasts September 2014
Macro Economic Outlook 2015 (only in Dutch), ISBN 978-90-1239-408-6, price 27,95 euro, can be ordered at: Webshop Sdu.
The revision of the National Accounts 2010 by Statistics Netherlands is incorporated in this outlook. The data for 2010-2013 are based entirely on information from Statistics Netherlands after revision, as published on StatLine in June 2014. The data for 2001-2009 are based on information from Statistics Netherlands after revision insofar available, completed by interpolations and estimates by CPB using trends before revision. The data for 2000 and earlier originate from before the revision 2010.
Downloads
 2015")
Raming van het bijstandsvolume in de MEV 2015

Beleidsmaatregelen hebben een beperkt opwaarts effect. Naar verwachting stijgt het aantal bijstandsuitkeringen in 2015 verder naar 377.000. De werkloosheid zal naar verwachting beperkt dalen in 2015, maar beleidseffecten veroorzaken een verdere toename van het bijstandsvolume.
Lees ook de Macro Economische Verkenning (MEV) 2015.
De Wet Werk en Bijstand (WWB) bepaalt dat gemeenten een eigen budget krijgen voor de uitvoering van de bijstand. Het ministerie van SZW informeert gemeenten drie keer per jaar over de hoogte van het macrobudget: in september van het voorgaande jaar over het voorlopige budget, in juni/juli van het lopende jaar over het nader voorlopige budget en in september van het lopende jaar over het definitieve budget. De hoogte van het budget wordt bepaald op basis van een raming voor het aantal bijstandsgerechtigden en de gemiddelde hoogte van een uitkering.
Het CPB publiceert ramingen van het aantal bijstandsgerechtigden in het lopende en komende jaar in het Centraal Economisch Plan (CEP) in maart en in de Macro Economische Verkenning (MEV) in september. Het uitgangspunt in de raming is de ramingsregel die het verband weergeeft tussen mutaties in de werkloze beroepsbevolking (WBB) en de mutatie in de bijstand.
Authors
CPBs short-term forecasts September 2014
- Main Conclusions
- The table 'Main economic indicators', 2012-2015
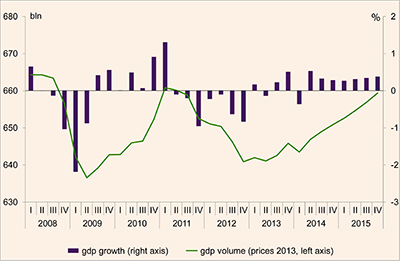
- Graph 'Economic growth in the Netherlands, 2008-2015'
- Related Publication
- Appendix: Main Economic Indicators for the Netherlands, 1970-2015
- Appendix: Main indicators labour market (E5), 1969-2015
Main conclusions
Read the accompanying press release.
Table 'Main economic indicators', 2012-2015 (MEV 2015)
| 2012 | 2013 | 2014 | 2015 | |
|---|---|---|---|---|
| Relevant world trade volume (%) |
0.7 |
1.7 |
2 1/2 |
4 1/2 |
| Export price competitors (%) |
4.1 |
-2.1 |
-1 |
1 |
| Crude oil price (Brent, level in dollars per barrel) |
111.7 |
108.7 |
108 |
107 |
| Exchange rate (dollar per euro) |
1.28 |
1.33 |
1.36 |
1.35 |
| Long-term interest rate the Netherlands (level in %) |
1.9 |
2.0 |
1.7 |
1.8 |
| 2012 | 2013 | 2014 | 2015 | |
|---|---|---|---|---|
| Gross domestic product (GDP, economic growth, %) |
-1.7 |
-0.7 |
3/4 |
1 1/4 |
| Consumption households (%) |
-1.4 |
-1.6 |
0 |
1 |
| Consumption general government (%) |
-1.6 |
-0.2 |
-3/4 |
0 |
| Capital formation including changes in stock (%) |
-5.8 |
-4.9 |
2 3/4 |
3 1/4 |
| Exports of goods and services (%) |
3.2 |
2.0 |
3 1/4 |
3 3/4 |
| Imports of goods and services (%) |
2.8 |
0.8 |
3 |
3 3/4 |
| 2012 | 2013 | 2014 | 2015 | |
|---|---|---|---|---|
| Price gross domestic product (%) |
1.3 |
1.0 |
1/2 |
1 1/4 |
| Export price domestically produced goods (non energy, %) |
1.8 |
-0.2 |
-3/4 |
3/4 |
| Import price goods (%) |
3.4 |
-1.5 |
-1 3/4 |
3/4 |
| National consumer price index (CPI, %) |
2.5 |
2.5 |
1 |
1 1/4 |
| Contractual wages market sector (%) |
1.6 |
1.2 |
1 1/4 |
1 1/2 |
| Purchasing power, static, median all households (%) |
-2.1 |
-1.4 |
1 1/2 |
1/2 |
| 2012 | 2013 | 2014 | 2015 | |
|---|---|---|---|---|
| Labour force (%) |
1.5 |
0.8 |
-1/2 |
1/4 |
| Active labour force (%) |
0.6 |
-0.7 |
-3/4 |
1/2 |
| Unemployment (in thousands of persons) |
469 |
600 |
620 |
605 |
| Unemployed rate (% of the labour force) |
5.3 |
6.7 |
7 |
6 3/4 |
| 2012 | 2013 | 2014 | 2015 | |
|---|---|---|---|---|
| Production (%) |
-1.9 |
-0.9 |
1 1/2 |
1 1/2 |
| Labour productivity (labour years, %) |
-1.3 |
-0.6 |
2 |
1 1/4 |
| Employment (labour years, %) |
-0.6 |
-1.5 |
-1/2 |
1/4 |
| Compensation per employee (%) |
2.3 |
2.6 |
3 |
1 1/4 |
| Labour share in enterprise income (level in %) |
79.5 |
81.4 |
81 3/4 |
81 |
| 2012 | 2013 | 2014 | 2015 | |
|---|---|---|---|---|
| Private savings (% of disposable household income) |
0.0 |
0.6 |
2 1/4 |
2 1/4 |
| Current-account balance (level in % GDP) |
8.8 |
8.5 |
8 1/2 |
8 3/4 |
| 2012 | 2013 | 2014 | 2015 | |
|---|---|---|---|---|
| General government financial balance (% GDP) |
-4.0 |
-2.3 |
-2.6 |
-2.2 |
| Gross debt general government (% GDP) |
66.5 |
68.6 |
69.7 |
70.2 |
| Taxes and social security contributions (% GDP) |
36.3 |
37.2 |
38.1 |
37.7 |
Both the wage-rate market sector, labour-income share and the private savings are biased upward for 2014 and 2015, due to the measure to limit the use of a so-called Stamrecht bv (severance pay insurance fund). Severance payments will be paid directly to the person involved, instead of into such a fund. After the revision of the National Accounts, severance payments are registered as employers' social security contributions. This translates into a non-recurring increase of the wage rate in 2014 which affects the development of the wages in the private sector well over 0.5% points.
Economic growth in the Netherlands, 2008-2015
Related publication
Downloads
