
Forecast June 2018
Continuing growth, increasing political risk

| 2017 | 2018 | 2019 | |
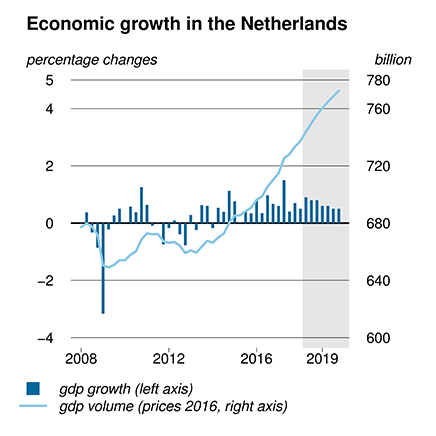
| Economic growth continuing | 3.2 | 2.9 | 2.7 |
| Inflation is increasing | 1.3 | 1.5 | 2.3 |
| Contract wage increases on the rise | 1.6 | 2.1 | 3.1 |
| Unemployment down to its lowest level since 2001 | 4.9 | 3.8 | 3.4 |
| Government budget surplus continues | 1.1 | 0.6 | 0.9 |
Unemployment is decreasing further, to its lowest level since 2001. The economic boom involves a strong increase in employment, which in turn causes a sharp decline in unemployment. Labour market shortages and higher inflation are causing a rise in contract wage increases. Higher oil prices and higher indirect taxation, in addition to the rising wage costs, all contribute to the increase in inflation. The government continues to have a budget surplus.
This forecast is published in CPB Policy Brief 2018/09 'Juniraming 2018' (only in Dutch).
Fan Charts June 2018
The figures present fan charts around the KMEV 2019 point forecasts for GDP growth, HICP inflation, unemployment and general government financial balance.
The solid line represents data realizations (2013-2017) and the KMEV 2019 point forecasts for 2018 and 2019. Around the central path the figures present a fan of confidence intervals:
• 30% confidence interval from the 35th to 65th percentile, dark blue area
• 60% confidence interval from the 20th to 80th percentile, dark blue + blue area
• 90% confidence interval from the 5th to 95th percentile, dark blue + blue + light blue area
The probability is thus 30% that the outcome will fall in the dark blue area and the probability is 10% that the outcome will fall outside the fan. In other words, the fan is a graphical representation of the likelihood of the various outcomes. The solid line represents the most likely outcome and outcomes are more likely when they are closer to the solid line.
Downloads

Contacts

UPDATE 19 November 2018
This improved version of this Background Document includes textual improvements, more details on simulation results in the appendix, and an extra trade-war scenario with only tariffs between the USA and the EU. These changes have no consequences for the analysis or conclusions presented in the report. The original version is available from the authors.
The economic effects of this trade conflict are limited, with the exception of a number of sectors in China and the US. The Chinese GDP loss will eventually increase to 1.2% of GDP. The GDP loss for the US will be limited to 0.3% due to the market power that they have. Other countries, including the EU, will even benefit from reduced trade between the US and China, Canada and Mexico. However, the EU benefit will evaporate when the US decides to also levy import tariffs on cars. At the sector level, the trade conflict will lead to significant shifts, especially in the US and China. These shifts concern sectors like the 'electronic equipment sector' , 'other machine equipment' and agriculture.
However, a full blown escalation of the trade conflict to a trade war only has losers. Illustrative simulations show this, with both the US and its trading partners increasing the tariffs on all imports. In that case strong effects will occur at modest levels of the tariffs. At higher rates the loss will continue to rise, but less quickly, because all sectors are already being priced out of the market. For the US it is crucial how many countries they involve in this trade war. The loss is particularly strong when the conflict is extended to 'other OECD countries', including Canada and Mexico. Anyway, China will most significantly be hurt by a trade war.
In January 2018, the US announced higher trade tariffs on solar panels that are imported mainly from China. They then announced in March 2018 that they would increase trade tariffs on steel and aluminum, including for the EU and NAFTA countries. On May 2, 2018, the US took a step back by relieving a number of countries of the steel and aluminum levies, namely South Korea, Australia, Brazil, and Argentina. In response to higher tariffs, China, the EU, Canada and Mexico filed a retaliatory package with the WTO. But the US also announced rates for other Chinese products in early April 2018. Immediately after that, China reacted again with the publication of a list of goods with a 25% tariff on the application.

Authors
>
Downloads

Table 'Main economic indicators', 2016-2019, June 2018, (a)
| 2016 | 2017 | 2018 | 2019 | |
| Relevant world trade volume goods and services (%) | 3.8 | 4.3 | 4.4 | 4.4 |
| Export price competitors (goods and services, non-commodities, %) | -3.7 | 2.4 | 0.0 | 1.3 |
| Crude oil price (dollar per barrel) | 44.3 | 55.0 | 72.2 | 68.8 |
| Exchange rate (dollar per euro) | 1.11 | 1.13 | 1.22 | 1.22 |
| Long-term interest rate the Netherlands (level in %) | 0.3 | 0.5 | 0.7 | 0.9 |
| 2016 | 2017 | 2018 | 2019 | |
| Gross domestic product (GDP, economic growth, %) | 2.2 | 3.2 | 2.9 | 2.7 |
| Consumption households (%) | 1.6 | 1.9 | 3.1 | 2.5 |
| Consumption general government (%) | 1.2 | 1.1 | 3.1 | 2.4 |
| Capital formation including changes in stock (%) | 3.1 | 4.8 | 5.6 | 4.2 |
| Exports of goods and services (%) | 4.3 | 6.1 | 4.3 | 4.6 |
| Imports of goods and services (%) | 4.1 | 5.4 | 5.4 | 5.2 |
| 2016 | 2017 | 2018 | 2019 | |
| Price gross domestic product (%) | 0.6 | 1.4 | 2.0 | 2.4 |
| Export price goods and services (non-energy, %) | -0.9 | 1.9 | 0.9 | 1.6 |
| Import price goods (%) | -4.4 | 4.5 | 1.7 | 0.6 |
| Inflation, harmonised index of consumer prices (hicp, %) | 0.1 | 1.3 | 1.5 | 2.3 |
| Compensation per hour private sector (%) | 0.6 | 1.5 | 2.9 | 4.0 |
| Contractual wages private sector (%) | 1.5 | 1.6 | 2.1 | 3.1 |
| Purchasing power, static, median, all households (%) | 2.6 | 0.2 | 0.6 | 1.6 |
| 2016 | 2017 | 2018 | 2019 | |
| Labour force (%) | 0.4 | 0.8 | 0.9 | 0.9 |
| Active labour force (%) | 1.3 | 2.1 | 2.0 | 1.3 |
| Unemployment (in thousands of persons) | 538 | 438 | 345 | 315 |
| Unemployed rate (% of the labour force) | 6.0 | 4.9 | 3.8 | 3.4 |
| Employment (hours, %) | 2.0 | 2.0 | 1.9 | 1.4 |
| 2016 | 2017 | 2018 | 2019 | |
| Labour share in enterprise income (level in %) | 72.9 | 71.7 | 71.6 | 72.3 |
| Labour productivity private sector (per hour, %) | 0.4 | 1.4 | 1.0 | 1.3 |
| Private savings (% of disposable household income) | 0.3 | 0.0 | -0.6 | -0.6 |
| Current-account balance (level in % GDP) | 8.7 | 10.2 | 9.5 | 9.4 |
| 2016 | 2017 | 2018 | 2019 | |
| General government financial balance (% GDP) | 0.4 | 1.1 | 0.6 | 0.9 |
| Gross debt general government (% GDP) | 61.8 | 56.6 | 52.8 | 49.0 |
| Taxes and social security contributions (% GDP) | 38.8 | 38.9 | 38.9 | 39.0 |
| Gross government expenditure (% GDP) | 43.9 | 42.9 | 42.7 | 42.2 |
(a) CPB uses as of MEV 2019 a new method for the calculation of the labour share in enterprise income. This new method takes better account of the income of self-employed persons and therefore better matches current economic reality. A joint 'notitie' of CBS, CPB and DNB is available on this subject (only in Dutch).