
Preliminary Forecast March 2018 (cCEP 2018)
Dutch economy outperforms that of the eurozone

| 2017 | 2018 | 2019 | |
| Gross domestic product (GDP): continued growth | 3.1 | 3.2 | 2.7 |
| Inflation (HICP) on the rise | 1.3 | 1.6 | 2.3 |
| Purchasing power (median, static) rises in 2019 | 0.3 | 0.6 | 1.6 |
| Unemployment (% labour force) falls down | 4.9 | 3.9 | 3.5 |
| EMU balance does not improve, compared to 2017 | 1.1 | 0.7 | 0.9 |
| EMU debt (ultimo year): steady decline | 56.0 | 52.1 | 48.4 |
Unemployment is decreasing rapidly to 3.9% this year, and 3.5% in 2019. The strong growth in employment can easily absorb new entrants into the labour market. Companies offer permanent labour contracts more often, and pay higher wages to either attract or hold on to staff. Rising labour costs and an increase in the low VAT tariff will cause inflation to increase to 2.3% in 2019. Nevertheless, median purchasing power will improve by 1.6% in 2019, because of the higher wages and lower income taxes.
The Dutch economic boom is the result of the favourable international economy, lower interest rates, an expansive budgetary policy, and a persistently strong housing market. These last two factors distinguish the Netherlands from other countries. The projections take a mild Brexit scenario into account in which a trade agreement is reached. However, negative consequences for the economy may increase, substantially, under a chaotic Brexit or in case of a disappointing negotiation result.
The government balance is not projected to improve, despite the booming economy. Last year, the surplus was 1.1% of GDP; it will be 0.7% this year and 0.9% in 2019. The already flourishing economy will be stimulated even further by increased spending on education and defence, and the rising expenditure on health care.
In addition to their focus on the latest economic figures, CPB also points to the limitations of purchasing power trends. Static purchasing power trends may provide insight into the general significance of economy and policy for Dutch citizens, but CPB warns that these trends are less suitable to be translated into personal spending opportunities. Policy may change the distribution range of income, but predicting it down to the smallest detail would ignore the uncertainty that is inextricably linked to projections. The full report, the Central Economic Plan 2018, is to be published on 22 March. It will include the same figures as those presented today. 
The global economy is flourishing, but also faces certain risks. The global economy is projected to grow by 3.9% in both 2018 and 2019, and world trade will increase by 4.4% in both years. Growth will be widespread, with the exception of the United Kingdom that will lag behind the eurozone. The low pound sterling is affecting purchasing power of UK households and the Brexit is discouraging investments. However, the eurozone has its own vulnerabilities, such as a number of weak banks, the ECB’s limited policy scope in case of a new shock, as well as political uncertainties. Despite the downward risks —also outside Europe— there are no concrete signs of global economic growth already having reached its peak.
Downloads
")
The Dutch labour market is tightening. In 2019, unemployment will decrease to 3.5%, its lowest point since 2001. The strong growth in employment can easily absorb the increase in labour supply. Companies more often are offering permanent labour contracts and pay higher wages to either attract or hold on to staff. Rising labour costs and a higher low VAT tariff will cause inflation to increase to 2.4% in 2019. Median static purchasing power will increase by 1.6% in 2019, due to various fiscal measures — which is an improvement compared to the 0.6% increase in 2018.
The budgetary balance is not improving, despite the economic boom. Already implemented policy, higher health care expenditure and increases in spending on education and defence will cause government expenditure to increase by 3.5% in 2018 and 2.4% in 2019. Although tax revenues will increase, the already flourishing economy on balance will be stimulated even further by increased spending on education and defence. In 2018 and 2019, budget surpluses will be 0.7% and 0.9% of GDP, respectively, following the 1.1% of 2017. Future decision-making around natural gas extraction from the Groningerveld will have a negative impact on public finances and economic growth — this has not yet been included in these projections, due to the related uncertainties.
Fan Charts CEP 2018
The figures present fan charts around the CEP 2018 point forecasts for GDP growth, HICP inflation, unemployment and general government financial balance.
The solid line represents data realizations (2013-2017) and the CEP 2018 point forecasts for 2018 and 2019. Around the central path the figures present a fan of confidence intervals:
- 30% confidence interval from the 35th to 65th percentile, dark blue area
- 60% confidence interval from the 20th to 80th percentile, dark blue + blue area
- 90% confidence interval from the 5th to 95th percentile, dark blue + blue + light blue area
The probability is thus 30% that the outcome will fall in the dark blue area and the probability is 10% that the outcome will fall outside the fan. In other words, the fan is a graphical representation of the likelihood of the various outcomes. The solid line represents the most likely outcome and outcomes are more likely when they are closer to the solid line.
Downloads

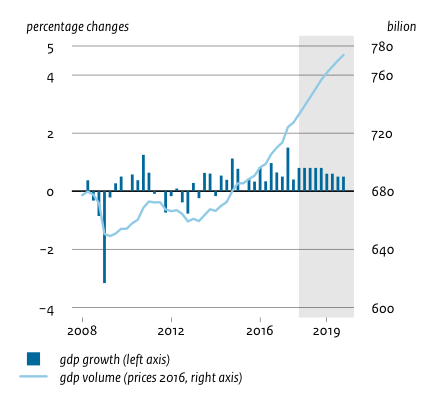
Economic growth in the Netherlands, 2008-2019
>
Downloads
, figures</a>")
Table 'Main economic indicators', 2016-2019, 6 March 2018, (a)
| 2016 | 2017 | 2018 | 2019 | |
| Relevant world trade volume goods and services (%) | 4.0 | 4.7 | 4.4 | 4.4 |
| Export price competitors (goods and services, non-commodities, %) | -3.6 | 1.6 | -0.2 | 1.1 |
| Crude oil price (dollar per barrel) | 43.5 | 54.0 | 67.7 | 63.6 |
| Exchange rate (dollar per euro) | 1.11 | 1.13 | 1.22 | 1.22 |
| Long-term interest rate the Netherlands (level in %) | 0.3 | 0.5 | 0.7 | 0.9 |
| 2016 | 2017 | 2018 | 2019 | |
| Gross domestic product (GDP, economic growth, %) | 2.2 | 3.1 | 3.2 | 2.7 |
| Consumption households (%) | 1.6 | 1.8 | 2.1 | 2.5 |
| Consumption general government (%) | 1.2 | 0.9 | 3.0 | 2.4 |
| Capital formation including changes in stock (%) | 3.1 | 5.0 | 6.0 | 4.2 |
| Exports of goods and services (%) | 4.3 | 5.5 | 4.9 | 4.6 |
| Imports of goods and services (%) | 4.1 | 4.9 | 5.1 | 5.2 |
| 2016 | 2017 | 2018 | 2019 | |
| Price gross domestic product (%) | 0.6 | 1.3 | 1.8 | 2.4 |
| Export price goods and services (non-energy, %) | -0.9 | 1.9 | 0.6 | 1.4 |
| Import price goods (%) | -4.4 | 4.5 | 1.0 | 0.3 |
| Inflation, harmonised index of consumer prices (hicp, %) | 0.1 | 1.3 | 1.6 | 2.3 |
| Compensation per hour private sector (%) | 0.6 | 1.5 | 2.9 | 4.0 |
| Contractual wages private sector (%) | 1.5 | 1.6 | 2.2 | 3.2 |
| Purchasing power, static, median, all households (%) | 2.6 | 0.3 | 0.6 | 1.6 |
| 2016 | 2017 | 2018 | 2019 | |
| Labour force (%) | 0.4 | 0.8 | 1.0 | 1.0 |
| Active labour force (%) | 1.3 | 2.1 | 2.0 | 1.5 |
| Unemployment (in thousands of persons) | 538 | 438 | 355 | 320 |
| Unemployed rate (% of the labour force) | 6.0 | 4.9 | 3.9 | 3.5 |
| Employment (hours, %) | 2.0 | 1.7 | 1.9 | 1.5 |
| 2016 | 2017 | 2018 | 2019 | |
| Labour share in enterprise income (level in %) | 72.9 | 71.8 | 71.7 | 72.5 |
| Labour productivity private sector (per hour, %) | 0.4 | 1.6 | 1.4 | 1.3 |
| Private savings (% of disposable household income) | 0.3 | -0.3 | 0.0 | 0.2 |
| Current-account balance (level in % GDP) | 8.7 | 9.5 | 9.4 | 9.2 |
| 2016 | 2017 | 2018 | 2019 | |
| General government financial balance (% GDP) | 0.4 | 1.1 | 0.7 | 0.9 |
| Gross debt general government (% GDP) | 61.8 | 56.0 | 52.1 | 48.4 |
| Taxes and social security contributions (% GDP) | 38.8 | 38.9 | 38.9 | 39.1 |
| Gross government expenditure (% GDP) | 43.8 | 43.1 | 42.6 | 42.2 |
(a) CPB uses as of MEV 2019 a new method for the calculation of the labour share in enterprise income. This new method takes better account of the income of self-employed persons and therefore better matches current economic reality. A joint 'notitie' of CBS, CPB and DNB is available on this subject (only in Dutch).