
Central Economic Plan (CEP) 2017
Central Economic Plan 2017 published, budget surplus; inflation dampens purchasing power

The Dutch economy will be receiving impulses in several areas, in 2017 and 2018. Exports will continue to do well, and companies will increase their investments. In addition, households (consumption), housing investments and government spending will also contribute to growth. Unemployment will drop this year to 4.9%, and in 2018 to 4.7%. Higher energy tariffs and natural resource prices will cause inflation in the entire eurozone to go up. For the Netherlands, this means an increase in inflation of 1.6% this year and 1.4% in 2018. The increasing inflation and ending of the 2016 policy package to ease the financial burden will lead to lower increases in median purchasing power in both this year and the next, compared to the 2014-2016 period.
Government finances
For this year, the government budget surplus is projected at 0.5% of GDP, increasing to 0.8% in 2018. This improvement is mainly due to substantially increasing tax revenues and decreasing expenditure on unemployment benefits. Declining natural gas revenues (lower production and lower prices) have the opposite effect. In 2017, for the first time since 2010, the government debt — at 58.5% of GDP — will be below the European debt ceiling of 60% of GDP, decreasing further in 2018 to 55.5%.
Global economy
Economic recovery is expected to continue, on a global level, particularly because of relatively high economic growth in emerging economies in Asia. Growth in the United States is robust, and projections for the short term are favourable. Economic growth in the eurozone is projected at 1.7%, for both this year and the next. Unemployment will decline in many EU countries, although it will still be above the long-term average. In the coming years, economic prospects, both on the global and the European level, will be surrounded by risks and uncertainty. This, among other things, is due to national elections in various EU Member States, implementation of the Brexit, and uncertainties about the policy of the new US Federal Government with respect to trade and regulation of the financial sector.
Medium term
Over the 2018-2021 period, the Dutch economy is projected to grow by an average 1.7% per year, which is shown in the actualisation of the medium-term outlook as included in the CEP. Employment and labour supply are increasing, in tandem, resulting in a stable 4.7% unemployment over this period. Interest rates and inflation will go up slightly, but remain low. The government budget by 2021 will have a surplus of 1.3% of GDP. Economic growth combined with a budget surplus will lead to a decrease in government debt, down to 46,6% by 2021. The sustainability balance, which indicates whether the current level of public services will be tenable in the long term, shows a surplus of 0.5% of GDP. As a result, the budget balance for 2021 and sustainability will improve by a respective 0.4 and 0.1 percentage points, compared against the most recent projections (MEV, September 2016), which also served as a basis for the calculations of this year’s election manifestos.
Structurally lower growth
For the coming decades, the growth potential of the Dutch economy will be lower than in the years preceding the financial and economic crises, as is concluded in the CEP. ‘Growth figures of 3%, 4% or even 5% are a thing of the past. Lower growth is the future, not only for the Netherlands, but also for many other western countries. This is the result, among other things, of population ageing and declining productivity growth. Stimulating potential growth is an option, but it can be intractable,’ according to CPB Director Laura van Geest.
In drafting the Central Economic Plan 2017, CPB as always assumed unchanged government policy. The upcoming formation of a new Cabinet — and the subsequent new Government Agreement — will undoubtedly have an impact on economic prospects
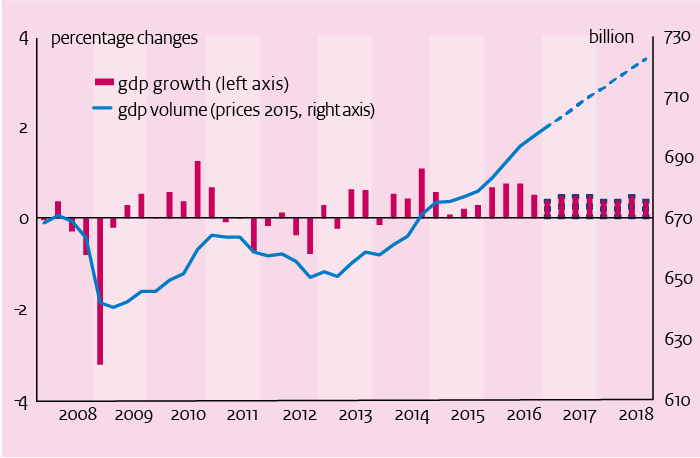
The growth of the Dutch economy is robust with 2.1% this year and 1.8% in 2018. This growth is mainly driven by consumption and exports. Economic growth is coupled with increases in employment in the market sector as well as in health care. For this year, unemployment is projected to be 4.9% of the labour force, and for next year this will be 4.7%. Influenced by higher energy prices, inflation will increase to 1.6% this year, and 1.4% the following year. The decrease in unemployment and increase in inflation will cause contract wages to rise. For both 2017 and 2018, a moderate increase in median static purchasing power is projected, for both 2017 and 2018, of 0.1% and 0.3%, respectively, following the 2.7% increase in 2016. Last year’s budget surplus is projected to increase further, to
0.8% of GDP by 2018, as continued economic growth will lead to higher revenues while government spending will lag behind.
The Dutch economy will grow with 1.7% on average in the period 2018-2021. The growth of labour supply and employment will be roughly equal, and hence unemployment will stabilise at 4,7%. Interest rates and inflation increase slightly, but remain low. The government budget balance will show a surplus of 1,3% in 2021 and government debt will decrease to 47% of GDP. The sustainability balance is in surplus, 0,5% GDP.
Downloads

Beschouwing uit CEP 2017
Download hiernaast de beschouwing.
Fan Charts March 2017
The figures present fan charts around the CEP 2017 point forecasts for GDP growth, HICP inflation, unemployment and general government financial balance.
The solid line represents data realizations (2012-2016) and the CEP 2017 point forecasts for 2017 and 2018. Around the central path the figures present a fan of confidence intervals:
- 30% confidence interval from the 35th to 65th percentile, dark blue area
- 60% confidence interval from the 20th to 80th percentile, dark blue + blue area
- 90% confidence interval from the 5th to 95th percentile, dark blue + blue + light blue area
The probability is thus 30% that the outcome will fall in the dark blue area and the probability is 10% that the outcome will fall outside the fan. In other words, the fan is a graphical representation of the likelihood of the various outcomes. The solid line represents the most likely outcome and outcomes are more likely when they are closer to the solid line.
Downloads

Contacts

Zijn de maatregelen structureel dan zal op termijn altijd een trendmatige daling van de schuldquote zichtbaar worden. De schuldaangroei is immers elk jaar lager, terwijl het noemereffect uitgewerkt raakt. Het verloop van de schuldquote ten opzichte van het basispad volgt dan de vorm van een omgekeerde U met een naar beneden weglopende rechterpoot. In dit achtergronddocument onderzoeken we waar het omslagpunt ligt, waarop de nieuwe schuldquote voor het eerst onder die van het basispad uitkomt, oftewel waar het verschil tussen beiden de horizontale as snijdt. Dit omslagpunt hangt van veel factoren af.
De centrale variabele in onze analyse is de omvang van de begrotingsmultiplier. Deze wordt gedefinieerd als de directe verandering in de bbp-volumegroei bij een fiscale inspanning om het overheidstekort met ex ante 1% van het bbp terug te dringen. Een grotere multiplier leidt in eerste instantie tot meer groeiterugval, een groter noemereffect en een omslagpunt dat verder naar de toekomst verschuift.
Over de omvang van deze multiplier lopen de schattingen in de literatuur sterk uiteen (paragraaf 2). Wel duidelijk is dat deze zal verschillen naar gelang de uitgangssituatie van de economie (recessie of oververhitting) en per type van beleidsmaatregelen (uitgavenbeperking of belastingverhoging). Ook monetaire beleidsreacties of de mate van openheid van de economie (weglekeffecten naar het buitenland) kunnen een rol spelen. De multiplier zal daardoor variëren per land en in de tijd.
In dit achtergronddocument onderzoeken we hoe groot de multiplier mag zijn opdat binnen een termijn van een aantal jaar (1, 3, of 5) het omslagpunt is bereikt. Om deze kritische waardes te berekenen, gebruiken we een daartoe ontwikkeld, klein economisch model TREMU (TREshold MUltiplier, paragraaf 3). Dit model is in hoofdlijnen gebaseerd op een recente studie van de ECB1, maar door ons verder uitgewerkt. We passen de berekeningen toe op meest recent beschikbare data voor Nederland (paragraaf 4) en testen de gevoeligheid van de gevonden kritische multiplierwaarde voor een aantal andere modelparameters, zoals de conjunctuurgevoeligheid van de overheidsuitgaven, langere hersteltijd van de begrotingsschok, prijsreacties in de conjunctuur en het mogelijk optreden van hysterese (paragraaf 5). In geval van hysterese wordt een deel van het negatieve effect van de tekortreducerende maatregelen op de economische groei niet meer goed gemaakt en zijn er dus bijkomende economische effecten. Ten slotte bekijken we kort in hoeverre de resultaten voor andere euro landen van die van Nederland zullen verschillen (paragraaf 6).
We kunnen concluderen dat onder normale economische omstandigheden, waarbij de economie zich in de buurt van een evenwichtig groeipad ontwikkelt, tekortreducerende maatregelen in Nederland relatief snel een verbetering van de schuldquote zullen laten zien. Ons land kan zich een hoge begrotingsmultiplier permitteren, voordat de schuldquote gaat oplopen. Zo mag in het referentiescenario de multiplier maximaal 1,5 zijn om na een jaar geen oploop van de schuldquote te zien en ruim 2,5 om binnen 3 jaar een verbetering te zien.2 De gevonden kritische waarden liggen daarmee boven het niveau, welke in de economische literatuur voor de multiplier veelal wordt gevonden. Dat hebben we vooral te danken aan het feit dat onze huidige staatsschuld in verhouding tot het bbp internationaal gezien relatief laag is. Daardoor blijven de noemereffecten beperkt. Bij alternatieve parameterveronderstellingen kunnen deze kritische waarden nog wel lager uitpakken tot maximaal een waarde van 1,0. In andere eurolanden, met name die met een aanzienlijk hogere schuldquote, ligt de kritische multiplierwaarde aanzienlijk lager. In die landen zullen op korte termijn de noemereffecten kunnen domineren, waardoor herstel van de schuldquote pas later zichtbaar wordt.
Lees ook het Centraal Economisch Plan 2017.
Authors

Accurate labour supply forecasting is important for the quality of unemployment forecasts. Many research institutes typically first forecast labour supply and employment and subsequently derive their unemployment forecast from these two underlying projections. In addition, our survey of 14 research institutes shows that their labour supply forecasting methods share several other characteristics:
- Core of the short-to-medium-term labour supply forecasting model usually consists of a multiplication of population projections and projected participation rates.
- Groups are important; usually the forecasting models are disaggregated into age and gender, and sometimes also according to nationality, education, or region;
- Nearly all institutes incorporate the influence of business cycle fluctuations and policy measures on labour supply, and manually adjust the results from their models, on the basis of expert opinion.
Analysing differences between labour supply projection methods of the various research institutes shows trade-offs between structure and flexibility and between details and modelling ease.
Our empirical analysis of labour market flows in relation to business cycle movements shows that groups matter: the flows between unemployment and non-participation are relatively more cyclical for women, and young and low-educated individuals. Moreover, using data on labour market flows to construct alternative forecasts in addition to central forecasts may be a promising avenue to pursue. The flows to and from non-participation are about 15 times higher than the resulting average absolute change in participation. Therefore, analysing labour market flow data sheds light on the hidden developments behind stock changes, and helps us to obtain a better understanding of labour market developments.
Practical lessons for CPB’s labour supply forecast are, for example:
- Using data on labour market flows, for instance, in flow models or BVARs to produce an alternative forecast of labour supply or its components, in addition to central forecasts, is an interesting option to explore;
Groups are important: when modelling labour supply, in addition to age and gender, also other distinctions could be made, such as, country of origin and educational attainment.
Downloads

Authors
Economic growth in the Netherlands, 2008-2018
>
Main economic indicators 2015-2018, March 2017
3,9
2,7
3,0
3,6
8,0
-3,0
1,1
1,1
51,9
43,3
55,5
56,1
1,11
1,11
1,07
1,07
0,7
0,3
0,7
0,7
| 2015 | 2016 | 2017 | 2018 | |
|---|---|---|---|---|
| Gross domestic product (GDP, economic growth, %) |
2,0 |
2,1 |
2,1 |
1,8 |
| Consumption households (%) |
1,8 |
1,8 |
2,0 |
1,4 |
| Consumption general government (%) |
0,2 |
0,7 |
0,8 |
1,0 |
| Capital formation (including changes in stock, %) |
6,2 |
4,3 |
3,6 |
2,8 |
| Exports of goods and services (%) |
5,0 |
3,7 |
3,5 |
3,9 |
| Imports of goods and services (%) |
5,8 |
3,9 |
3,6 |
3,9 |
| 2015 | 2016 | 2017 | 2018 | |
|---|---|---|---|---|
| Price gross domestic product (%) |
0,1 |
1,0 |
1,2 |
1,4 |
| Export price goods and services (non-energy, %) |
0,7 |
-1,0 |
0,9 |
1,0 |
| Import price goods (%) |
-5,1 |
-4,5 |
5,1 |
1,0 |
| Inflation, harmonised index of consumer prices (HICP, %) |
0,2 |
0,1 |
1,6 |
1,4 |
| Contractual wages market sector (%) |
1,3 |
1,7 |
1,8 |
2,1 |
| Purchasing power, static, median all households (%) |
1,2 |
2,7 |
0,1 |
0,3 |
| 2015 | 2016 | 2017 | 2018 | |
|---|---|---|---|---|
| Labour force (%) |
0,4 |
0,4 |
0,8 |
0,8 |
| Active labour force (%) |
1,0 |
1,3 |
2,0 |
1,1 |
| Unemployment (in thousands of persons) |
614 |
538 |
445 |
430 |
| Unemployment rate (% of the labour force) |
6,9 |
6,0 |
4,9 |
4,7 |
| 2015 | 2016 | 2017 | 2018 | |
|---|---|---|---|---|
| Production (%) |
2,8 |
2,6 |
2,8 |
2,1 |
| Labour productivity (hours, %) |
1,6 |
0,3 |
1,0 |
1,4 |
| Employment (hours, %) |
1,2 |
2,3 |
1,9 |
0,7 |
| Compensation per hour (%) |
0,2 |
1,6 |
2,6 |
2,6 |
| Labour share in enterprise income (level in %) |
77,1 |
77,7 |
78,3 |
78,4 |
| 2015 | 2016 | 2017 | 2018 | |
|---|---|---|---|---|
| Private savings (% of disposable household income) |
0,2 |
0,9 |
0,0 |
0,3 |
| Current-account balance (level in % GDP) |
8,5 |
8,7 |
8,2 |
8,2 |
| 2015 | 2016 | 2017 | 2018 | |
|---|---|---|---|---|
| General government financial balance (% GDP) |
-2,0 |
0,3 |
0,5 |
0,8 |
| Gross debt general government (% GDP) |
65,1 |
61,8 |
58,5 |
55,5 |
| Taxes and social-security contributions (% GDP) |
37,7 |
39,0 |
39,3 |
39,3 |
Downloads
