
Macro Economic Outlook (MEV) 2013
Forecasted Dutch budget deficit 2013 remains at 2.7 percent
This was announced today by CPB in its publication Macro Economic Outlook 2013 (MEV 2013). These figures are similar to the draft figures published on 22 August.
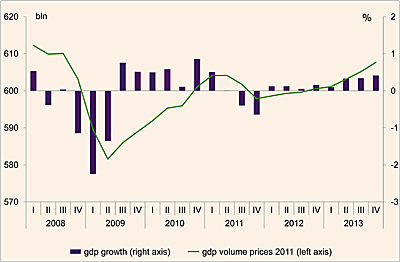
In 2012 the size of the Dutch economy contracts by ½ percent GDP, while a slight recovery is expected of ¾ percent in 2013. Domestic consumption slows the growth: both household and government consumption decreases in both years. Investments will go up slightly in 2013, after a decline in 2012. Exportation of goods will perform relatively well, among others due to a small recovery of world trade in 2013. The labour market forecasts remain gloom. As a result of low production levels, employment rates decrease both in the current and the next year. In 2013, average unemployment is expected to be 5¾ percent, which is a level not seen since the nineteen-nineties. Median purchasing power declines by 1¾ percent in 2012 and by ¾ percent in 2013. Purchasing power has also declined in the previous two years. Taken together, this amounts to a 4 percent decline of median purchasing power in four years.
The forecasted budget deficit (EMU balance) improves from 3.7 percent in 2012 to 2.7 percent GDP in 2013. The structural deficit (the deficit adjusted for the business cycle) is lower, at 1.2 percent in 2013. The improved budget deficit is mainly the result of restrictive budget policies and partly due to the modest economic recovery in 2013. In 2013 the budget deficit will be below the Maastricht Treaty ceiling for the first time since 2008. The deficit reduction is mainly achieved through raising public finance burdens. Despite the deficit reduction government debt will grow to 71.8 percent GDP in 2013.
The European debt crisis remains the most significant downward risk. However, recent decision-making by the European Central Bank, the ruling of the German Constitutional Court and perhaps also the plans for establishing a European Banking Union, give a first glance of a structural solution for the crisis.
Read the accompanying press release or the complete publication in Dutch.
Related publications:
Short-term forecasts September 2012
The Macro Economic Outlook 2013 (only in Dutch), ISBN 978-90-1257-7-052, price 27,50 euro, can be ordered from September 20, 2012 at:
Sdu Service Centre Publishers
www.sdu.nl
P.O. Box 20014
2500 EA The Hague
The Netherlands
Telephone : +31-70-3789880
Downloads

CPBs short-term forecasts September 2012
- Main Conclusions
- The table 'Extended main economic indicators', 2010-2013
- Graph 'Economic growth in the Netherlands, 2008-2013'
- Related Publication
- Appendix: Main Economic Indicators for the Netherlands, 1970-2013
- Appendix: Main indicators labour market (E7), 1969-2013
Main conclusions
Read the accompanying press release (MEV 2013).
Table 'Extended main economic indicators', 2010-2013
| 2010 | 2011 | 2012 | 2013 | |
|---|---|---|---|---|
| Relevant world trade (vol. %) | 11.3 | 4.0 | 1/4 | 3 1/2 |
| Import price goods (%) | 7.3 | 4.9 | 2 | -1/4 |
| Export price competitors (%) | 7.9 | 6.3 | 3 1/2 | 1 1/2 |
| Crude oil price (Brent, $) | 79.5 | 111.3 | 104 | 95 |
| Exchange rate (dollar p euro) | 1.33 | 1.39 | 1.27 | 1.25 |
| Long-term interest rate (level in %) | 3.0 | 2.9 | 2.0 | 2.4 |
| 2010 | 2011 | 2012 | 2013 | |
|---|---|---|---|---|
| Gross domestic product (GDP, economic growth) (%) | 1.6 | 1.0 | -1/2 | 3/4 |
| Value gross domestic product (GDP) (bln euro) | 588.7 | 602.0 | 607 | 622 |
| Private consumption (%) | 0.3 | -1.0 | -1 | 0 |
| Public demand (%) | 0.3 | -0.6 | -3/4 | -3/4 |
| Gross fixed investment, private non-residential (%) | -5.2 | 10.2 | -2 3/4 | 3 1/4 |
| Exports of goods (non-energy) (%) | 13.5 | 4.3 | 4 1/4 | 4 1/4 |
| of which domestically produced (%) | 9.7 | 3.8 | -1/4 | 3 1/4 |
| re-exports (%) | 17.0 | 4.7 | 8 1/4 | 4 3/4 |
| Imports of goods (%) | 12.2 | 4.1 | 3 1/2 | 2 3/4 |
| 2010 | 2011 | 2012 | 2013 | |
|---|---|---|---|---|
| Export price goods (excluding energy) (%) | 4.3 | 1.4 | 1 | 1 |
| Price competitiveness (%) | 2.2 | 0.8 | 3 | 1 |
| Consumer prices (CPI) (%) | 1.3 | 2.3 | 2 1/4 | 2 |
| Consumer prices (harmonised, HICP) (%) | 0.9 | 2.5 | 2 1/2 | 1 3/4 |
| Price of gross domestic product (%) | 1.1 | 1.2 | 1 1/4 | 1 3/4 |
| Price of national expenditure (%) | 1.2 | 0.8 | 1 3/4 | 2 |
| Contractual wages market sector (%) | 1.0 | 1.4 | 1 3/4 | 2 1/4 |
| Compensation per full-time employee market sector (%) | 1.7 | 2.1 | 3 1/4 | 2 3/4 |
| Gross wage Jones family (in euro's) | 32500 | 33000 | 33000 | 33500 |
| Purchasing power (Jones, one-income household) (%) | -1.2 | -1.2 | -2 1/4 | -1/2 |
| Purchasing power (median, all households) (%) | -0.5 | -0.9 | -1 3/4 | -3/4 |
| 2010 | 2011 | 2012 | 2013 | |
|---|---|---|---|---|
| Population (x 1000 pers.) | 16615 | 16693 | 16755 | 16820 |
| Labour force (15-74) (x 1000 pers.) | 8748 | 8744 | 8860 | 8890 |
| Employed labour force (15-74) (x 1000 pers.) | 8357 | 8357 | 8390 | 8365 |
| Unemployment (x 1000 pers.) | 391 | 387 | 470 | 520 |
| Employed Persons (15-74) (%) | -0.4 | 0.7 | 0 | -1/4 |
| Labour force (15-74) (%) | -0.3 | 0.0 | 1 1/4 | 1/4 |
| Employed labour force (15-74) (%) | -1.1 | 0.0 | 1/2 | -1/4 |
| Unemployment rate (% labour force) | 4.5 | 4.4 | 5 1/4 | 5 3/4 |
| Idem, national definition (% labour force) | 5.5 | 5.3 | 6 1/4 | 7 |
| 2010 | 2011 | 2012 | 2013 | |
|---|---|---|---|---|
| Production (%) | 1.1 | 1.4 | -1 1/4 | 1 |
| Labour productivity (%) | 2.9 | 1.0 | -1 1/4 | 2 |
| Employment (labour years) (%) | -1.8 | 0.4 | 0 | -1 |
| Price gross value added (%) | 2.0 | 0.3 | 1/2 | 3/4 |
| Real labour costs (%) | -0.3 | 1.8 | 2 3/4 | 1 3/4 |
| Labour share in enterprise income (level in %) | 78.7 | 78.7 | 81 3/4 | 81 1/4 |
| 2010 | 2011 | 2012 | 2013 | |
|---|---|---|---|---|
| General government financial balance (% GDP) | -5.1 | -4.5 | -3.7 | -2.7 |
| Gross debt general government (% GDP) | 63.1 | 65.5 | 71.4 | 71.8 |
| Taxes and social security contributions (% GDP) | 38.8 | 38.4 | 39.0 | 40.0 |
Economic growth in the Netherlands, 2008-2013
Related publication
Downloads
