
Projections March 2023 (CEP 2023)
Purchasing power restored through wage growth, but more people living below the poverty line

Energy prices have fallen sharply in recent months, but, on the other hand, inflation has spread to other goods and services. There is now clear momentum in wage growth, however. Purchasing power will remain unchanged on average this year, partly due to the support policy. It will recover next year, but is still set to show an overall decline in the 2021-2024 period. Poverty will rise to 5.8% of the population in 2024, as a number of temporary income measures for the lowest incomes are set to end next year in accordance with the currently stated policies.
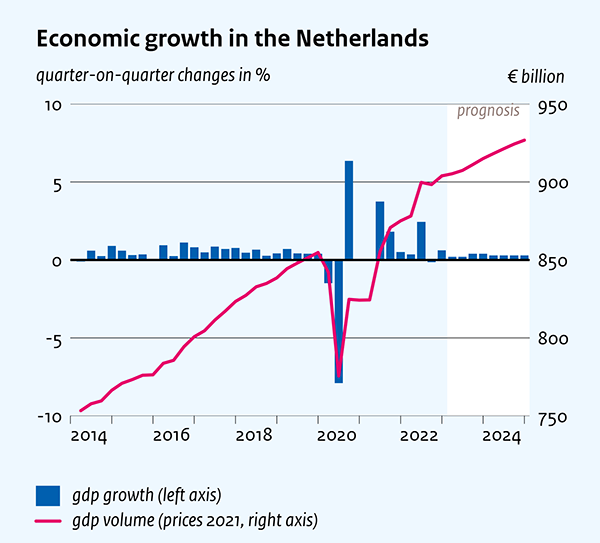
Growth despite headwinds
The Dutch economy will grow by 1.6% and 1.4% respectively in 2023 and 2024, despite inflation, weaker international trade and falling house prices. The labour market is projected to remain tight, with unemployment rising only slightly to 4.1% in 2024.
Public finances
The EMU deficit will deteriorate sharply this year to 3.0% of GDP, mainly due to additional income support to compensate for higher energy prices. In 2024, the deficit will be 2.6% of GDP. For both years, it has been assumed that the government will be unable to spend all the budgeted funds, partly as a result of labour shortages. CPB nevertheless assumes that the government will be able to do so over the medium term. Coupled with the steady rise in interest charges, this will lead to a further deterioration in public finances, according to an outlook for the period up to 2031. After the current cabinet term, the deficit is projected to exceed 3% of GDP. EMU debt, which remains stable at around 50% of GDP in 2023 and 2024, then enters a rising trajectory, reaching 60% of GDP in 2031.
CPB Director Pieter Hasekamp: “We see a recovery in purchasing power now that inflation is falling, and wage growth is picking up. But the number of people living below the poverty line is set to rise again next year due to the ending of temporary government support. We also see the government deficit continuing to rise in the years ahead. That calls for much more targeted support than is currently the case.”
| 2022 | 2023 | 2024 | |
| Growth holds up despite energy shock (GDP, growth %) | 4.5 | 1.6 | 1.4 |
| Labour market remains tight, unemployment rises slightly (% of labour force) | 3.5 | 3.9 | 4.1 |
| Purchasing power recovers next year due to higher wages (median, %*) | -2.7 | -0.2 | 2.0 |
| Poverty still rises due to termination of temporary policy (% in poverty*) | 4.7 | 4.7 | 5.8 |
| Public finances deteriorate due to additional expenditure (EMU balance, % of GDP) | -0.7 | -3.0 | -2.6 |
* purchasing power and poverty calculated using the alternative CPI, which takes account of the delayed impact of energy prices due to current energy contracts.
Downloads

.

Lees ook het Centraal Economisch Plan (CEP) 2023.
Contacts


We find that higher energy prices increase the overall price level. When nominal wages are more rigid than prices, real labor income falls by more than real capital income, such that consumption that earn income from labor see a larger fall in real consumption. Higher prices imply that with a given consumption bundle and production level, real gross domestic income falls. Complete indexation of wages to inflation raises a trade-off between equity and efficiency. Wage indexation reduces inequality, but also slows down the macroeconomic recovery in the short run and reduces total consumption of both groups in the long run relative to no wage indexation.
Downloads

Contacts

Authors

Downloads

Table 'Main economic indicators', 2021-2024, March 2023
| 2021 | 2022 | 2023 | 2024 | |
| Relevant world trade volume goods and services (%) | 8.4 | 6.9 | 2.2 | 2.9 |
| Export price competitors (goods and services, non-commodities, %) | 5.9 | 10.7 | 2.8 | 1.9 |
| Crude oil price (dollar per barrel) | 70.7 | 100.8 | 84.3 | 79.7 |
| Exchange rate (dollar per euro) | 1.18 | 1.05 | 1.07 | 1.08 |
| Long-term interest rate the Netherlands (level in %) | -0.3 | 1.4 | 2.3 | 2.3 |
| 2021 | 2022 | 2023 | 2024 | |
| Gross domestic product (GDP, economic growth, %) | 4.9 | 4.5 | 1.6 | 1.4 |
| Household consumption (%) | 3.6 | 6.6 | 1.7 | 1.4 |
| Government consumption (%) | 5.2 | 0.7 | 2.8 | 1.6 |
| Capital formation including changes in stock (%) | 2.9 | 1.5 | 1.3 | 1.5 |
| Exports of goods and services (%) | 5.2 | 5.3 | 3.7 | 2.3 |
| Imports of goods and services (%) | 4.0 | 4.4 | 4.2 | 2.5 |
| 2021 | 2022 | 2023 | 2024 | |
| Price gross domestic product (%) | 2.5 | 5.4 | 6.2 | 3.0 |
| Export price goods and services (%) | 8.3 | 16.9 | 0.6 | 1.6 |
| Import price goods and services (%) | 10.2 | 20.6 | -0.1 | 1.2 |
| Inflation, national consumer price index (CPI, %) | 2.7 | 10.0 | 3.0 | 3.1 |
| Alternative CPI (purchasing power and poverty figures) (%) (a) | 2.0 | 6.7 | 6.5 | 3.2 |
| Inflation, harmonised index of consumer prices (HICP, %) | 2.8 | 11.6 | 2.9 | 3.2 |
| Compensation per hour private sector (%) (b) | 0.1 | 3.1 | 6.1 | 5.1 |
| Wages as determined in collective labour agreements, private sector (%) | 2.2 | 3.1 | 5.0 | 5.0 |
| Purchasing power, static, median all households (%) (c) | 1.0 | -2.7 | -0.2 | 2.0 |
| People in poverty (level in %) (c,d) | 5.6 | 4.7 | 4.7 | 5.8 |
| 2021 | 2022 | 2023 | 2024 | |
| Labour force (%) | 0.9 | 2.4 | 2.2 | 0.8 |
| Active labour force (%) | 1.5 | 3.1 | 1.8 | 0.6 |
| Unemployment (in thousands of persons) | 408 | 349 | 395 | 415 |
| Unemployed rate (% of the labour force) | 4.2 | 3.5 | 3.9 | 4.1 |
| Employment (hours, %) | 3.3 | 4.3 | 1.2 | 0.4 |
| 2021 | 2022 | 2023 | 2024 | |
| Labour share in enterprise income (level in %) | 74.5 | 72.7 | 71.3 | 72.2 |
| Labour productivity private sector (per hour, %) | 2.5 | 0.5 | 0.4 | 1.1 |
| Private savings (% of disposable household income) | 11.5 | 7.4 | 8.3 | 8.6 |
| Current-account balance (level in % GDP) | 7.2 | 6.5 | 6.6 | 6.8 |
| 2021 | 2022 | 2023 | 2024 | |
| General government financial balance (% GDP) | -2.6 | -0.7 | -3.0 | -2.6 |
| Gross debt general government (% GDP) | 52.4 | 49.3 | 48.4 | 48.7 |
| Taxes and social security contributions (% GDP) | 39.7 | 39.1 | 38.3 | 38.1 |
| Gross government expenditure (% GDP) | 47.0 | 44.5 | 45.2 | 44.4 |
(a) The alternative CPI takes into account prices of both new and existing energy contracts. See par. 1.4 of the 'Central Economic Plan-CEP-2023-Verdieping' (in Dutch, link) for more information on the alternative cpi series and see CBS (in Dutch, link).
(b) The NOW wage cost subsidy, and the continuity contribution to health care, have a downward effect of 2.0%-points in 2021 and 1.2%-points in 2022.
(c) The alternative cpi has been taken into account for the median purchasing power figures and the persons in poverty.
(d) The ratio of the number of persons in households below the poverty line and the total number of persons. The modest-but-adequate budget of the Netherlands Institute for Social Research has been used as the poverty line.
Contacts
Contacts