
Projections September 2022 (MEV 2023)
Temporary policy softens impact of energy crisis in 2023

CPB Director Pieter Hasekamp: “The purchasing power package provides temporary relief in particular for households with the lowest incomes. They are also most affected by high energy prices. At the same time, our stress test shows that not everyone will be helped, particularly if the gas price turns out to be even higher. Households with high energy consumption and incomes just above the social minimum risk getting into financial difficulties.”
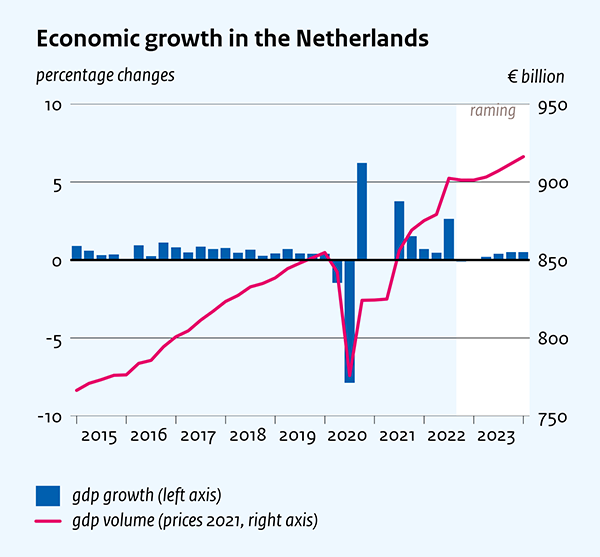
The war in Ukraine and the resulting energy crisis are causing a shift in the economic picture. Inflation is eroding household spending, markedly slowing the rate of economic growth after a strong recovery from the coronavirus crisis. The government policy softens this effect, with the result that consumption growth is more favourable than previously anticipated. Businesses will benefit from the support for demand, leading to output growth in 2023. The lower end of the income distribution will benefit most from the policy. Whereas a further rise in the number of people in poverty was previously projected, the number falls to 4.9% of the population after the policy is included. The policy is largely temporary, however, so if energy prices remain high after 2023 and policy remains unchanged, poverty will rise again and purchasing power will fall. In order to emphasise the uncertainty, variants with lower and higher gas prices have also been calculated. In an unfavourable scenario, purchasing power in 2022 and 2023 will be cumulatively more than four percentage points worse.
| MEV | difference cMEV | ||||
| 2021 | 2022 | 2023 | 2023 | ||
| Inflation peaks this year, falls next year as a result of policy (CPI, %) | 2.7 | 9.9 | 2.6 | -1.7 | |
| Economic growth slows after strong recovery (GDP, growth %) | 4.9 | 4.6 | 1.5 | +0.4 | |
| Purchasing power recovers partly due to temporary policy (median, %) | 0.3 | -6.8 | 3.9 | +3.3 | |
| Policy package reduces poverty in 2023 (persons, %) | 5.7 | 6.7 | 4.9 | -2.6 | |
| Balance sharply lower due to purchasing power policy (% GDP) | -2.6 | -1.1 | -2.5 | -1.4 |
Stress test
At the request of the House of Representatives, CPB has conducted a new “cost of living” stress test. The stress test shows that, compared to the picture in the cMEV, the policy in the Budget Memorandum will almost halve the number of households at risk of payment difficulties in 2023, to 540,000. This assumes unchanged energy usage and gas prices at the same level as in the baseline projections. In a variant with a higher gas price, the number rises to 860,000 households. The temporary policy increases the incomes of the lowest income households, reducing their vulnerability. On the other hand, households with high energy bills are more vulnerable as a result of the high prices, even above 120% of the social minimum. This also implies that any supplementary policy to reduce vulnerability should ideally target energy bills: through accelerated sustainability or targeted compensation on energy bills.
BTW The policy in the Budget Memorandum has been included in these projections. The underlying economic picture has not been updated; it is the same as in the draft Macro Economic Outlook (cMEV) of August, which included economic data up to the end of July. Differences between the cMEV and the MEV therefore result from the policy in the Budget Memorandum. The policy measures that were submitted up to 7 September are incorporated in the MEV. The additional additional measures announced by the government on Budget Day have not been included in these projections.
Downloads

.
Fan Charts September 2022 (MEV 2023)
The figures present fan charts around the MEV 2023 forecasts for GDP growth, HICP inflation, unemployment and the general government financial balance.
The solid line represents data realisations (2017-2021) and the MEV 2023 projections for 2022 and 2023. Around the central path the figures present a fan of confidence intervals:
- 30% confidence interval from the 35th to 65th percentile, dark blue area
- 60% confidence interval from the 20th to 80th percentile, dark blue + blue area
- 90% confidence interval from the 5th to 95th percentile, dark blue + blue + light blue area
The fan is a graphical representation of the likelihood of the various outcomes. The solid line represents the most likely outcome and outcomes are more likely when they are closer to the solid line. The probability is thus 30% that the outcome will fall in the dark blue area and 10% that the outcome will fall outside the fan.
Since the fan charts are based on past forecast errors, the width of each confidence intervals can be thought of as a combination of how accurate the forecasts are and how volatile the economic variables were in the period 2001-2021. The more stable the economic variables were, the smaller the prediction errors were. If the current volatility is higher than in the period in which the average forecast errors were calculated, then the width of these bands is likely an underestimate of the true uncertainty. This is now the case, for example, in the inflation estimate. Between 2001-2021 inflation was between 1% and 3% fifteen times out of 21, so the prediction errors were small. These historical prediction errors are most likely an underestimate of the current uncertainty. The point estimate of the 2022 HICP inflation estimate is 11.4%. Because the gas price is very decisive for inflation, we have also included two variants in the MEV 2023 in which the gas price turns out to be higher or lower than in the basic projections.
Downloads
")
Contacts


Lees ook de Macro Economische Verkenning (MEV) 2023.
Dit Verdiepingsdocument biedt meer achtergronden bij deze raming, van het macro-economisch beeld, de overheidsbegroting en de koopkracht. Naast een cijfermatige onderbouwing wordt ook stilgestaan bij de relevante aannames en onzekerheden rondom deze cijfers.
Contacts


In totaal zijn 24 fiscale maatregelen aan een toetsing onderworpen. De budgettaire inschatting van vrijwel alle fiscale maatregelen is omgeven met een gemiddelde tot hoge mate van onzekerheid.
Authors


Voor de bekostiging van uitkeringen op grond van de Participatiewet ontvangen gemeenten een budget van SZW. De hoogte van het budget wordt bepaald op basis van een raming voor het aantal uitkeringsgerechtigden en de gemiddelde hoogte van een bijstandsuitkering. Het CPB publiceert ramingen van het aantal bijstandsuitkeringen in het lopende en komende jaar in het Centraal Economisch Plan (CEP) in maart en in de Macro Economische Verkenning (MEV) in september.
Authors


Het risico is klein dat de schuld op de middellange termijn onhoudbaar wordt. Uitgaande van het basispad uit het Centraal Economisch Plan 2022 blijft de schuld in 90% van de gevallen onder 76% van het bbp.
Authors

Wanneer rentes op overheidsschuld toenemen vertaalt zich dat in een toename van de staatsschuld. Zo leidt een structurele nominale rente van 3% tot een staatsschuld van ruim 150% in 2060. Hierbij is echter geen rekening gehouden met toekomstige beleidsveranderingen om deze toename van de schuld te beperken. Ook zijn de aannames omtrent economische groei en inflatie ongewijzigd gelaten.
Niet alle rentepaden zijn even waarschijnlijk. De laatste decennia daalt de reële rente door structurele factoren zoals de toename van spaartegoeden en afname van de vraag naar krediet. Hoge reële rentes zijn de komende decennia daarom minder waarschijnlijk. Dit geldt met name voor de 6% variant in deze publicatie.
Authors
Downloads

Table 'Main economic indicators', 2020-2023, September 2022
| 2020 | 2021 | 2022 | 2023 | |
| Relevant world trade volume goods and services (%) | -9.1 | 8.4 | 4.9 | 2.9 |
| Export price competitors (goods and services, non-commodities, %) | 0.3 | 6.1 | 9.7 | 3.2 |
| Crude oil price (dollar per barrel) | 41.8 | 70.7 | 105.3 | 89.7 |
| Exchange rate (dollar per euro) | 1.14 | 1.18 | 1.06 | 1.02 |
| Long-term interest rate the Netherlands (level in %) | -0.4 | -0.3 | 1.1 | 1.6 |
| 2020 | 2021 | 2022 | 2023 | |
| Gross domestic product (GDP, economic growth, %) | -3.9 | 4.9 | 4.6 | 1.5 |
| Household consumption (%) | -6.4 | 3.6 | 5.7 | 1.8 |
| Government consumption (%) | 1.6 | 5.2 | 1.7 | 3.2 |
| Capital formation including changes in stock (%) | -6.3 | 2.9 | 2.5 | 1.2 |
| Exports of goods and services (%) | -4.3 | 5.2 | 4.0 | 3.2 |
| Imports of goods and services (%) | -4.8 | 4.0 | 2.8 | 3.9 |
| 2020 | 2021 | 2022 | 2023 | |
| Price gross domestic product (%) | 1.9 | 2.5 | 4.2 | 4.9 |
| Export price goods and services (%) | -2.9 | 8.3 | 16.6 | 2.9 |
| Import price goods and services (%) | -3.6 | 10.2 | 22.1 | 2.6 |
| Inflation, national consumer price index (CPI, %) | 1.3 | 2.7 | 9.9 | 2.6 |
| Inflation, harmonised index of consumer prices (HICP, %) | 1.1 | 2.8 | 11.4 | 2.5 |
| Compensation per hour private sector (%) (a) | 7.9 | 0.1 | 2.4 | 4.6 |
| Wages as determined in collective labour agreements, private sector (%) | 2.8 | 2.2 | 2.9 | 3.7 |
| Purchasing power, static, median all households (%) | 2.6 | 0.3 | -6.8 | 3.9 |
| People in poverty (level in %)(b) | 5.6 | 5.7 | 6.7 | 4.9 |
| 2020 | 2021 | 2022 | 2023 | |
| Labour force (%) | 0.4 | 0.9 | 1.7 | 1.4 |
| Active labour force (%) | 0.0 | 1.5 | 2.5 | 1.0 |
| Unemployment (in thousands of persons) | 465 | 408 | 340 | 385 |
| Unemployed rate (% of the labour force) | 4.9 | 4.2 | 3.4 | 3.9 |
| Employment (hours, %) | -2.8 | 3.3 | 5.2 | 0.5 |
| 2020 | 2021 | 2022 | 2023 | |
| Labour share in enterprise income (level in %) | 76.3 | 74.5 | 75.0 | 73.3 |
| Labour productivity private sector (per hour, %) | -1.5 | 2.5 | -0.4 | 1.1 |
| Private savings (% of disposable household income) | 12.8 | 11.5 | 6.2 | 5.7 |
| Current-account balance (level in % GDP) | 7.1 | 9.0 | 7.2 | 6.8 |
| 2020 | 2021 | 2022 | 2023 | |
| General government financial balance (% GDP) | -3.7 | -2.6 | -1.1 | -2.5 |
| Gross debt general government (% GDP) | 54.7 | 52.4 | 49.6 | 48.8 |
| Taxes and social security contributions (% GDP) | 39.9 | 39.7 | 39.2 | 38.2 |
| Gross government expenditure (% GDP) | 48.2 | 47.0 | 45.7 | 45.7 |
(a) The NOW wage cost subsidy, and the continuity contribution to health care, have an upward effect on the wage mutation in 2020 of 3.3%-points and a downward effect of 2.0%-points in 2021 and 1.2%-points in 2022.
(b) The ratio of the number of persons in households below the poverty line and the total number of persons. The modest-but-adequate budget of the Social and Cultural Planning Office has been used as the poverty line.
Contacts
Contacts