
Projections November 2020
Economy will recover in 2021, provided coronavirus is under control

CPB Director Pieter Hasekamp: ‘The second corona wave does not lead to a fundamentally different economic outlook for 2021. However, certain sectors, such as the hospitality industry, culture and tourism, will once again be severely affected by new physical contact restrictions. The government's generic support policy (NOW, TOZO) is keeping pace with economic development. From the perspective of economic stabilisation, therefore, there is no reason to reconsider the phasing out of this support policy. Nevertheless, there may be other reasons for accommodating affected sectors; such support preferably should be temporary and targeted.’
| Baseline projections: Main Economic Indicators | 2019 | 2020 | 2021 |
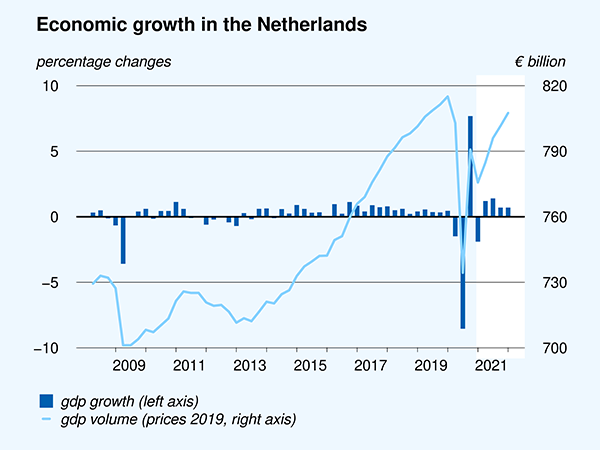
| Partial GDP recovery in 2021 | 1.7 | -4.2 | 2.8 |
| Further increase in unemployment in 2021 | 3.4 | 4.1 | 6.1 |
| Lower increase in static purchasing power next year | 1.0 | 2.2 | 1.0 |
| Large government deficit, also next year (% of GDP) | 1.7 | -6.1 | -4.6 |
| Debt ratio levelling off at substantially higher level (% of GDP) | 48.7 | 56.7 | 59.0 |
Economic recovery very strongly depends on how the pandemic will develop. To do justice to this uncertainty, CPB also added a 'start–stop scenario' to its projections that includes new corona waves and insufficiently available or effective vaccines. Under such a scenario, the economy will contract by slightly less than 1% in 2021 and unemployment will increase to more than 8% by the end of 2021.
The corona recession will have a negative impact on wage growth in 2021 and therefore also on any increase in purchasing power. Wage increases under collective labour agreements (CAOs) will decline, from 2.5% in 2020 to 1.4% in 2021. As a result of reductions in the financial burden, purchasing power will still increase by 1.0%, although this is lower than the 2.2% of 2020. These static purchasing power figures do not include the fact that layoffs and lost revenues for self-employed independents cause strong income losses for large numbers of people and that the government has been carrying part of the wage costs.
Economic recovery and the phase-out of financial support measures halfway through the year will lead to a decrease in government deficit in 2021. The projected deficit is 4.6% of GDP in 2021, which is 1.5% below that of 2020. This will also lead to a substantial softening of the increase in the debt ratio.
Corona dampens growth in productivity and labour supply in the medium term
In addition to the November projections, CPB also published an update on the medium-term outlook (MLT), today. The MLT provides an outlook through to 2022–2025 and forms the basis for the analysis of the election manifestos. The economy is projected to gradually recover from the corona recession. The corona outbreak is leading to a 4% lower GDP level by 2025 than was projected in the MLT of March, which not yet included a coronavirus impact. In 2022–2025, annual GDP growth will be 1.5%; there will be no increase in static purchasing power during this period. Unemployment will gradually decline to 4.5% by 2025. Assuming no changes in policy, the government deficit will decrease to 1.2% of GDP by 2025. The corona outbreak will worsen the sustainability balance, which provides an indication of the extent to which the financial burden will be shifted to future generations. According to the current projections, the sustainability gap is 2.4% of GDP.
Contacts

Downloads

This projection is published in CPB Policy Brief 'Novemberraming: Economische vooruitzichten 2021' (only in Dutch).
Fan Charts November 2020
The figures present fan charts around the November 2020 point forecasts for GDP growth, HICP inflation, unemployment and general government financial balance.
The solid line represents data realizations and the November 2020 point forecasts for 2020 and 2021. Around the central path the figures present a fan of confidence intervals:
- 30% confidence interval from the 35th to 65th percentile, dark blue area
- 60% confidence interval from the 20th to 80th percentile, dark blue + blue area
- 90% confidence interval from the 5th to 95th percentile, dark blue + blue + light blue area
The probability is thus 30% that the outcome will fall in the dark blue area and the probability is 10% that the outcome will fall outside the fan. In other words, the fan is a graphical representation of the likelihood of the various outcomes. The solid line represents the most likely outcome and outcomes are more likely when they are closer to the solid line.
Downloads

Contacts

Downloads

Table 'Main economic indicators', 2018-2021, November 2020
| 2018 | 2019 | 2020 | 2021 | |
| Relevant world trade volume goods and services (%) | 3.7 | 3.1 | -8.8 | 6.0 |
| Export price competitors (goods and services, non-commodities, %) | -0.7 | 3.3 | 0.3 | 0.0 |
| Crude oil price (dollar per barrel) | 70.9 | 64.3 | 41.1 | 44.5 |
| Exchange rate (dollar per euro) | 1.18 | 1.12 | 1.14 | 1.18 |
| Long-term interest rate the Netherlands (level in %) | 0.6 | -0.1 | -0.4 | -0.4 |
| 2018 | 2019 | 2020 | 2021 | |
| Gross domestic product (GDP, economic growth, %) | 2.4 | 1.7 | -4.2 | 2.8 |
| Household consumption (%) | 2.2 | 1.5 | -7.0 | 3.7 |
| Government consumption (%) | 1.7 | 1.6 | 2.7 | 3.4 |
| Capital formation including changes in stock (%) | 3.9 | 3.6 | -7.8 | 3.4 |
| Exports of goods and services (%) | 4.3 | 2.7 | -4.4 | 2.6 |
| Imports of goods and services (%) | 4.7 | 3.2 | -4.8 | 3.6 |
| 2018 | 2019 | 2020 | 2021 | |
| Price gross domestic product (%) | 2.4 | 3.0 | 2.2 | 1.5 |
| Export price goods and services (non-energy, %) | 0.9 | 1.0 | 0.0 | 0.7 |
| Import price goods (%) | 2.2 | -1.1 | -5.1 | 0.7 |
| Inflation, harmonised index of consumer prices (HICP, %) | 1.6 | 2.7 | 1.2 | 1.3 |
| Compensation per hour private sector (%) (a) | 1.9 | 2.4 | 5.4 | -0.1 |
| Wages as determined in collective labour agreements, private sector (%) | 2.0 | 2.4 | 2.5 | 1.4 |
| Purchasing power, static, median all households (%) | 0.0 | 1.0 | 2.2 | 1.0 |
| 2018 | 2019 | 2020 | 2021 | |
| Labour force (%) | 1.2 | 1.6 | 0.4 | 0.0 |
| Active labour force (%) | 2.3 | 2.0 | -0.3 | -2.0 |
| Unemployment (in thousands of persons) | 350 | 314 | 380 | 565 |
| Unemployed rate (% of the labour force) | 3.8 | 3.4 | 4.1 | 6.1 |
| Employment (hours, %) | 2.6 | 2.2 | -3.8 | 1.4 |
| 2018 | 2019 | 2020 | 2021 | |
| Labour share in enterprise income (level in %) | 73.4 | 74.0 | 72.9 | 74.1 |
| Labour productivity private sector (per hour, %) | -0.1 | -0.5 | -0.2 | 1.8 |
| Private savings (% of disposable household income) | 3.2 | 3.1 | 9.3 | 8.1 |
| Current-account balance (level in % GDP) | 10.8 | 9.9 | 9.8 | 9.3 |
| 2018 | 2019 | 2020 | 2021 | |
| General government financial balance (% GDP) | 1.4 | 1.7 | -6.1 | -4.6 |
| Gross debt general government (% GDP) | 52.4 | 48.7 | 56.7 | 59.0 |
| Taxes and social security contributions (% GDP) | 38.8 | 39.3 | 39.1 | 39.2 |
| Gross government expenditure (% GDP) | 42.8 | 42.4 | 49.7 | 48.2 |
(a) The NOW wage cost subsidy, and the continuity contribution to health care, have an upward effect on the wage mutation in 2020 of 2.8%-points and a downward effect of 1.9%-points in 2021.
Contacts
Contacts