
Projections March 2021 (CEP 2021)
Economic recovery in sight, but coronavirus effects linger on

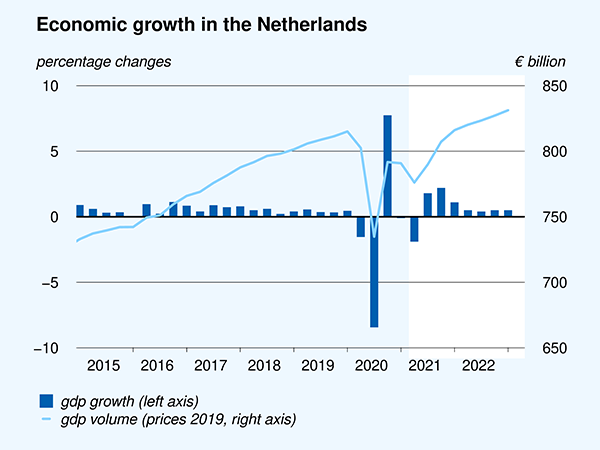
Due to the second coronavirus wave, economic growth figures for 2021 are slightly below those published in the November Projections. The surprising decrease in unemployment of recent months has led to a downward revision of the projected unemployment. Pieter Hasekamp, CPB Director: ‘While the course of the pandemic continues to surprise us in a negative sense, the economy has in fact proven to be resilient. Despite the lockdown, which has heavily affected specific sectors, the economy as a whole is doing relatively well. Recovery is in sight, but once the virus has been brought under control, the economic impact of the crisis will still be felt. Support policies must then be quickly phased out and replaced by policies aimed at facilitating economic recovery. We expect that not all companies will survive and that unemployment will rise temporarily. In a way, this is inevitable; the normal economic dynamic will have to resume at some point.’
| Main Economic Indicators, baseline projections | 2020 | 2021 | 2022 |
| GDP growth shows resilience (% growth) | -3.7 | 2.2 | 3.5 |
| Unemployment peaks in 2022 (%) | 3.8 | 4.4 | 4.7 |
| No increase in household purchasing power next year (% growth) | 2.4 | 0.7 | -0.1 |
| Expiration of support will decrease budgetary deficit (% of GDP) | -4.3 | -5.9 | -1.7 |
| Debt ratio already decreases next year (% GDP) | 54.4 | 58.6 | 56.9 |
The corona-induced recession pushes down wage growth in 2021 and thus dampens the increase in household purchasing power. The contractual wage increase in the market sector declines from 2.7% in 2020 to 1.5% in both 2021 and 2022. Because of a reduction in taxes and premiums, this year will still see an increase in purchasing power of 0.7%, although this is lower than the 2.4% of 2020. Under unchanged policy, household purchasing power will decrease by 0.1% next year.
The government deficit will peak at almost 6% of GDP, this year, and then decrease to 1.7% in 2022, thanks to the expiration of financial support measures and the increase in tax revenues. As a result, the debt ratio is expected to decline next year, to 57% of GDP.
Because of the considerable uncertainty, these projections also include a pessimistic and an optimistic scenario, in addition to the baseline projections. Under the pessimistic scenario, new coronavirus variants, against which current vaccinations prove insufficient, will cause another coronavirus outbreak in the autumn. This new outbreak will trigger additional cautious behaviour in households as well as new restrictive measures, which in turn will reduce GDP and further increase unemployment. Under the optimistic scenario, positive household and business expectations will lead to a stronger recovery after the lifting of social distancing measures.
Economic growth next government period of 2% per year
In addition to the Central Economic Plan, an update of the Medium Term Outlook was also published today. This offers a look ahead to 2022–2025 and can be used when analysing the new coalition agreement. GDP growth will be 2.0%, per year, in 2022–2025. Based on unchanged policy, the government deficit will decrease to 1.0% of GDP in 2025. The sustainability deficit, which gives an indication of the extent to which financial burdens are shifted to future generations, has worsened due to the coronavirus crisis and amounts to 1.8% of GDP.
Contacts

Downloads

Fan Charts March 2021
The figures present fan charts around the CEP 2021 point forecasts for GDP growth, HICP inflation, unemployment and general government financial balance.
The solid line represents data realizations (2015-2020) and the CEP 2021 point forecasts for 2021 and 2022. Around the central path the figures present a fan of confidence intervals:
- 30% confidence interval from the 35th to 65th percentile, dark blue area
- 60% confidence interval from the 20th to 80th percentile, dark blue + blue area
- 90% confidence interval from the 5th to 95th percentile, dark blue + blue + light blue area
The probability is thus 30% that the outcome will fall in the dark blue area and the probability is 10% that the outcome will fall outside the fan. In other words, the fan is a graphical representation of the likelihood of the various outcomes. The solid line represents the most likely outcome and outcomes are more likely when they are closer to the solid line.
Downloads

Contacts

Downloads

Table 'Main economic indicators', 2019-2022, March 2021
| 2019 | 2020 | 2021 | 2022 | |
| Relevant world trade volume goods and services (%) | 3.1 | -9.0 | 6.0 | 6.0 |
| Export price competitors (goods and services, non-commodities, %) | 3.1 | 0.4 | 1.1 | 0.9 |
| Crude oil price (dollar per barrel) | 64.3 | 41.8 | 62.6 | 59.2 |
| Exchange rate (dollar per euro) | 1.12 | 1.14 | 1.22 | 1.22 |
| Long-term interest rate the Netherlands (level in %) | -0.1 | -0.4 | -0.3 | -0.2 |
| 2019 | 2020 | 2021 | 2022 | |
| Gross domestic product (GDP, economic growth, %) | 1.7 | -3.7 | 2.2 | 3.5 |
| Household consumption (%) | 1.5 | -6.4 | 0.6 | 6.1 |
| Government consumption (%) | 1.6 | 1.4 | 5.7 | 0.2 |
| Capital formation including changes in stock (%) | 3.6 | -4.0 | 2.3 | 2.8 |
| Exports of goods and services (%) | 2.7 | -4.3 | 2.6 | 5.2 |
| Imports of goods and services (%) | 3.2 | -4.3 | 3.0 | 5.4 |
| 2019 | 2020 | 2021 | 2022 | |
| Price gross domestic product (%) | 3.0 | 2.4 | 1.5 | 1.6 |
| Export price goods and services (non-energy, %) | 1.0 | -0.4 | 1.3 | 1.0 |
| Import price goods (%) | -1.1 | -4.8 | 4.8 | 0.1 |
| Inflation, harmonised index of consumer prices (HICP, %) | 2.7 | 1.1 | 1.9 | 1.4 |
| Compensation per hour private sector (%) (a) | 2.4 | 6.8 | 0.4 | 0.1 |
| Wages as determined in collective labour agreements, private sector (%) | 2.4 | 2.7 | 1.7 | 1.5 |
| Purchasing power, static, median all households (%) | 1.0 | 2.4 | 0.7 | -0.1 |
| 2019 | 2020 | 2021 | 2022 | |
| Labour force (%) | 1.6 | 0.4 | -0.1 | 1.3 |
| Active labour force (%) | 2.0 | 0.0 | -0.8 | 1.1 |
| Unemployment (in thousands of persons) | 314 | 357 | 415 | 445 |
| Unemployed rate (% of the labour force) | 3.4 | 3.8 | 4.4 | 4.7 |
| Employment (hours, %) | 2.2 | -3.5 | 2.0 | 1.5 |
| 2019 | 2020 | 2021 | 2022 | |
| Labour share in enterprise income (level in %) | 74.0 | 74.3 | 74.6 | 74.6 |
| Labour productivity private sector (per hour, %) | -0.5 | 0.0 | 0.4 | 2.2 |
| Private savings (% of disposable household income) | 3.1 | 9.4 | 11.0 | 5.9 |
| Current-account balance (level in % GDP) | 9.9 | 8.9 | 8.9 | 9.0 |
| 2019 | 2020 | 2021 | 2022 | |
| General government financial balance (% GDP) | 1.7 | -4.3 | -5.9 | -1.7 |
| Gross debt general government (% GDP) | 48.7 | 54.4 | 58.6 | 56.9 |
| Taxes and social security contributions (% GDP) | 39.3 | 39.7 | 39.1 | 38.8 |
| Gross government expenditure (% GDP) | 42.4 | 48.6 | 49.1 | 44.9 |
(a) The NOW wage cost subsidy, and the continuity contribution to health care, have an upward effect on the wage mutation in 2020 of 3.4%-points and a downward effect of 1.7%-points in 2021 and 1.4%-points in 2022.
Contacts

Contacts