
Forecast December 2019
Decelerating growth, persisting underinvestments

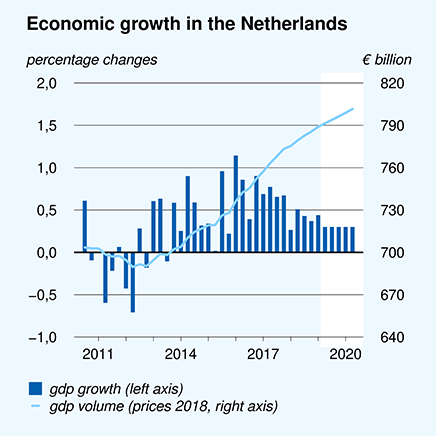
This is concluded by CPB Netherlands Bureau for Economic Policy Analysis in this year’s December Projections. CPB Director Laura van Geest states: ‘Although the economy is slowing down, the Netherlands is still doing well, compared to the eurozone. The issues around nitrogen and PFASs will not be without consequences for the affected sectors, but, for the Netherlands as a whole, the short-term effect will be only limited.’
| Main Economic Indicators | 2018 | 2019 | 2020 |
| GDP growth slowing down, below the normal pace | 2.6 | 1.7 | 1.3 |
| Unemployment will remain low | 3.8 | 3.4 | 3.6 |
| Inflation, following the tax impact in 2019, will revert back to a moderate level | 1.6 | 2.7 | 1.4 |
| CAO wage rises increasing (1) | 2.0 | 2.5 | 2.8 |
| Purchasing power increasing further | 0.1 | 1.0 | 2.1 |
| Government budget surplus declining | 1.5 | 1.4 | 0.8 |
A positive development is projected for purchasing power in the coming year, due to increases in real wages and reductions in the financial burden. On average, purchasing power will increase by 2.1% in 2020. As a result of the announced exemption scheme for pension funds with a solvency ratio of at least 90%, the implementation of pension cuts and increases in premium payments, at most pension funds, will be postponed until 2021. For the coming year, the increase in the purchasing power of pensioners is estimated at 1.0%. Although pensioners will benefit from reductions in the financial burden, their supplementary pension will hardly be indexed.
For 2020, the budget surplus is expected to be reduced on the back of expansionary policies and lower growth levels. At the same time, the budget will be less expansionary than envisaged, in both 2019 and 2020. The December Projections foresee underspending to the tune of EUR 4 billion in 2019 and EUR 3 billion in 2020, due to labour market shortages, nitrogen and PFAS issues and in light of the information in the Autumn Memorandum.
(1) CAO = Collective Labour Agreement
This forecast is published in CPB Policy Brief 'Decemberraming 2019' (only in Dutch).
Downloads

Fan Charts December 2019
The figures present fan charts around the December 2019 point forecasts for GDP growth, HICP inflation, unemployment and general government financial balance.
The solid line represents data realizations and the December 2019 point forecasts for 2019 and 2020. Around the central path the figures present a fan of confidence intervals:
- 30% confidence interval from the 35th to 65th percentile, dark blue area
- 60% confidence interval from the 20th to 80th percentile, dark blue + blue area
- 90% confidence interval from the 5th to 95th percentile, dark blue + blue + light blue area
The probability is thus 30% that the outcome will fall in the dark blue area and the probability is 10% that the outcome will fall outside the fan. In other words, the fan is a graphical representation of the likelihood of the various outcomes. The solid line represents the most likely outcome and outcomes are more likely when they are closer to the solid line.
Downloads

Contacts

Lees ook het CPB Achtergronddocument 'MIMOSI: Microsimulatiemodel voor belastingen, sociale zekerheid, loonkosten en koopkracht' .
De microgegevens die nu ten grondslag aan de modeluitkomsten liggen, zijn ontleend aan een steekproef van het Inkomens- en Vermogensonderzoek (IIV) 2016 van het CBS. Het verleggen van het basisjaar van 2013 naar 2016 zorgt voor een belangrijke verbetering van de raming. Het nieuwe bronbestand zorgt voor een actueler beeld en vegroot de nauwkeurigheid van de koopkrachtberekening. Ook vormt het nieuwe bronbestand de basis voor de koopkrachtberekeningen bij de komende ramingen, Kansrijk studies, Keuzes-in-Kaart en de doorrekening van het Regeerakkoord.
Als gevolg van deze actualisering neemt de mediane koopkrachtmutatie voor alle huishoudens met 0,1% af. Deze mutatie geldt voor de jaren 2017 tot en met 2020. De neerwaartse bijstelling van de koopkrachtmutatie komt door een opwaartse bijstelling in het niveau: door het gebruik van recentere gegevens en de herziening van de Inkomensstatistiek van het CBS geldt dat huishoudens nu meer inkomen hebben. Zij ontvangen meer loon, winst, pensioen en huurwaarde in vergelijking met het vorige bronbestand. Dit betekent dat huishoudens minder op vooruit zijn gegaan dan eerder berekend, doordat hun inkomen hoger is in de uitgangssituatie.
Authors
Downloads

Table 'Main economic indicators', 2017-2020, December 2019
| 2017 | 2018 | 2019 | 2020 | |
| Relevant world trade volume goods and services (%) | 5.5 | 3.3 | 2.3 | 1.4 |
| Export price competitors (goods and services, non-commodities, %) | 2.1 | 0.3 | 2.3 | 1.0 |
| Crude oil price (dollar per barrel) | 54.3 | 70.9 | 63.8 | 58.7 |
| Exchange rate (dollar per euro) | 1.13 | 1.18 | 1.12 | 1.11 |
| Long-term interest rate the Netherlands (level in %) | 0.5 | 0.6 | -0.1 | -0.2 |
| 2017 | 2018 | 2019 | 2020 | |
| Gross domestic product (GDP, economic growth, %) | 2.9 | 2.6 | 1.7 | 1.3 |
| Household consumption (%) | 2.1 | 2.3 | 1.4 | 1.9 |
| Government consumption (%) | 0.9 | 1.6 | 1.7 | 2.3 |
| Capital formation including changes in stock (%) | 4.2 | 2.2 | 4.6 | 1.1 |
| Exports of goods and services (%) | 6.5 | 3.7 | 2.3 | 2.2 |
| Imports of goods and services (%) | 6.2 | 3.3 | 3.0 | 2.9 |
| 2017 | 2018 | 2019 | 2020 | |
| Price gross domestic product (%) | 1.3 | 2.2 | 2.9 | 1.7 |
| Export price goods and services (non-energy, %) | 1.3 | 1.0 | 1.2 | 1.0 |
| Import price goods (%) | 3.6 | 2.7 | -0.8 | -0.2 |
| Inflation, harmonised index of consumer prices (HICP, %) | 1.3 | 1.6 | 2.7 | 1.4 |
| Compensation per hour private sector (%) | 0.9 | 1.8 | 3.0 | 3.0 |
| Wages as determined in collective labour agreements, private sector (%) | 1.5 | 2.0 | 2.5 | 2.8 |
| Purchasing power, static, median all households (%) | 0.2 | 0.1 | 1.0 | 2.1 |
| 2017 | 2018 | 2019 | 2020 | |
| Labour force (%) | 0.8 | 1.2 | 1.5 | 0.9 |
| Active labour force (%) | 2.1 | 2.3 | 1.9 | 0.7 |
| Unemployment (in thousands of persons) | 438 | 350 | 315 | 335 |
| Unemployed rate (% of the labour force) | 4.9 | 3.8 | 3.4 | 3.6 |
| Employment (hours, %) | 2.0 | 2.2 | 1.7 | 0.8 |
| 2017 | 2018 | 2019 | 2020 | |
| Labour share in enterprise income (level in %) | 73.3 | 73.1 | 73.9 | 74.8 |
| Labour productivity private sector (per hour, %) | 0.9 | 0.6 | 0.1 | 0.6 |
| Private savings (% of disposable household income) | 3.0 | 2.8 | 3.1 | 3.8 |
| Current-account balance (level in % GDP) | 10.8 | 11.2 | 9.4 | 9.5 |
| 2017 | 2018 | 2019 | 2020 | |
| General government financial balance (% GDP) | 1.3 | 1.5 | 1.4 | 0.8 |
| Gross debt general government (% GDP) | 56.9 | 52.4 | 49.0 | 46.6 |
| Taxes and social security contributions (% GDP) | 38.6 | 38.7 | 39.2 | 38.9 |
| Gross government expenditure (% GDP) | 42.9 | 42.5 | 42.2 | 42.6 |