
Projections March 2022 (CEP 2022)
Energy price increase has unequal impact; uncertainty dominates projections

Rising energy prices have an impact on static purchasing power. In the baseline projections, purchasing power in 2022 decreases by an average 2.7%, in the high variant it would decline by 3.4%, and in the low variant by 0.6%. It should however be borne in mind that the impact of these energy prices will vary, considerably, per household. CPB Director Pieter Hasekamp: ‘We assume that, sooner or later, everyone will feel the impact of a higher energy bill. But whether this impact will be a mere nudge or a big blow depends on the share of energy costs in people’s disposable income. I do worry about people on lower incomes, especially if they live in a poorly insulated house. These types of effects are not visible in the standard purchasing power charts.’
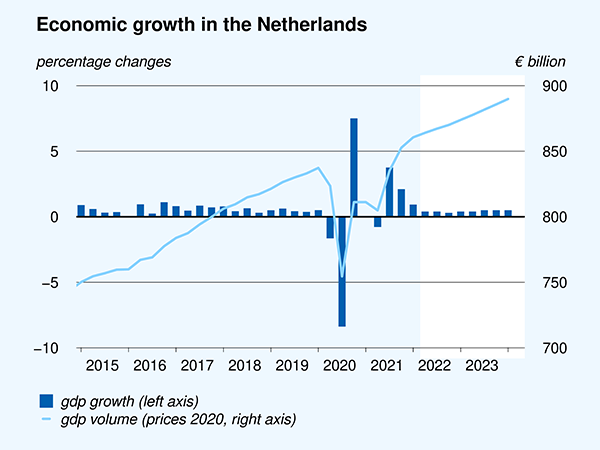
CPB furthermore projects a continued increase in domestic production levels. The economy is expected to grow by 3.6% in 2022 and 1.7% in 2023, with consumption and exports making the largest contributions. In the coming years, growth will also be driven by the additional spending that results from the coalition agreement. The labour market is projected to remain tight, with unemployment rising only slightly to 4.3% in 2023.
| Projections March 2022 (CEP 2022) | 2020 | 2021 | 2022 | 2023 |
| Production increases (GDP growth, in %) | -3.8 | 4.8 | 3.6 | 1.7 |
| Labour market remains tight (unemployment, % labour force) | 4.9 | 4.2 | 4.0 | 4.3 |
| High energy prices result in substantially higher inflation (CPI, in %) | 1.3 | 2.7 | 5.2 | 2.4 |
| Static purchasing power this year declining, recovering thereafter (%) | 2.5 | 0.1 | -2.7 | 1.9 |
| Government deficit decreasing, in the short term (% of GDP) | -4.2 | -4.4 | -2.5 | -2.3 |
CPB’s Central Economic Plan (CEP) also contains an outlook on the budgetary and economic developments up to 2030. It shows that, amongst other things, purchasing power development will be slightly positive throughout the current government term (2022–2025), because wage growth will exceed inflation in the years after 2022. The outlook also shows that the additional spending from the coalition agreement will become apparent in the government finances, particularly after 2025, on top of the effect of population ageing. The government deficit increases to 3.5% of GDP by 2030, while the government debt increases by about 8 percentage points between 2025 and 2030, up to 61% of GDP.
Downloads

.
Fan Charts March 2022
The figures present fan charts around the CEP 2022 point forecasts for GDP growth, HICP inflation, unemployment and general government financial balance.
The solid line represents data realizations (2017-2021) and the CEP 2022 point forecasts for 2022 and 2023. Around the central path the figures present a fan of confidence intervals:
- 30% confidence interval from the 35th to 65th percentile, dark blue area
- 60% confidence interval from the 20th to 80th percentile, dark blue + blue area
- 90% confidence interval from the 5th to 95th percentile, dark blue + blue + light blue area
The probability is thus 30% that the outcome will fall in the dark blue area and the probability is 10% that the outcome will fall outside the fan. In other words, the fan is a graphical representation of the likelihood of the various outcomes. The solid line represents the most likely outcome and outcomes are more likely when they are closer to the solid line.
Since the fan charts are based on past forecast errors, the width of each confidence intervals can be thought of as a combination of how accurate the estimates are and how volatile the economic variables were in the period 2001-2021. The more stable the economic variables were, the smaller the prediction errors were. If the current volatility is higher than in the period in which the average forecast errors were calculated, then the width of these bands is likely an underestimate of the true uncertainty. This is now the case, for example, in the inflation estimate. Between 2001-2021 inflation was between 1% and 3% fifteen times out of 21, so the prediction errors were small. These historical prediction errors are most likely an underestimate of the current uncertainty. The point estimate of the 2022 HICP inflation estimate is 5.9%. This increased uncertainty is why we have also included two more extreme inflation scenarios (in Dutch) in the CEP publication.
Downloads

Contacts


Downloads

Table 'Main economic indicators', 2020-2023, March 2022
| 2020 | 2021 | 2022 | 2023 | |
| Relevant world trade volume goods and services (%) | -9.2 | 7.5 | 6.6 | 4.9 |
| Export price competitors (goods and services, non-commodities, %) | -0.1 | 6.0 | 4.7 | 1.2 |
| Crude oil price (dollar per barrel) | 41.8 | 70.7 | 91.3 | 83.1 |
| Exchange rate (dollar per euro) | 1.14 | 1.18 | 1.14 | 1.14 |
| Long-term interest rate the Netherlands (level in %) | -0.4 | -0.3 | 0.0 | 0.1 |
| 2020 | 2021 | 2022 | 2023 | |
| Gross domestic product (GDP, economic growth, %) | -3.8 | 4.8 | 3.6 | 1.7 |
| Household consumption (%) | -6.6 | 3.5 | 4.7 | 1.5 |
| Government consumption (%) | 1.0 | 7.1 | 1.7 | 2.6 |
| Capital formation including changes in stock (%) | -5.4 | -2.0 | 5.4 | 4.4 |
| Exports of goods and services (%) | -4.8 | 6.9 | 4.9 | 4.3 |
| Imports of goods and services (%) | -5.5 | 5.2 | 5.5 | 5.5 |
| 2020 | 2021 | 2022 | 2023 | |
| Price gross domestic product (%) | 2.3 | 2.5 | 3.4 | 3.0 |
| Export price goods and services (non-energy, %) | -0.4 | 5.4 | 5.3 | 1.4 |
| Import price goods and services (%) | -3.4 | 10.2 | 9.2 | 0.0 |
| Inflation, national consumer price index (CPI, %) | 1.3 | 2.7 | 5.2 | 2.4 |
| Inflation, harmonised index of consumer prices (HICP, %) | 1.1 | 2.8 | 5.9 | 2.2 |
| Compensation per hour private sector (%) (a) | 7.6 | -0.2 | 2.3 | 3.4 |
| Wages as determined in collective labour agreements, private sector (%) | 2.8 | 2.2 | 2.8 | 3.5 |
| Purchasing power, static, median all households (%) | 2.5 | 0.1 | -2.7 | 1.9 |
| 2020 | 2021 | 2022 | 2023 | |
| Labour force (%) | 0.4 | 0.8 | 0.8 | 1.0 |
| Active labour force (%) | 0.0 | 1.5 | 1.0 | 0.7 |
| Unemployment (in thousands of persons) | 465 | 408 | 385 | 425 |
| Unemployed rate (% of the labour force) | 4.9 | 4.2 | 4.0 | 4.3 |
| Employment (hours, %) | -2.7 | 2.2 | 2.9 | 0.9 |
| 2020 | 2021 | 2022 | 2023 | |
| Labour share in enterprise income (level in %) | 74.9 | 72.2 | 70.7 | 71.1 |
| Labour productivity private sector (per hour, %) | -1.3 | 3.3 | 0.9 | 0.8 |
| Private savings (% of disposable household income) | 11.6 | 8.7 | 4.1 | 4.6 |
| Current-account balance (level in % GDP) | 7.0 | 9.4 | 9.8 | 9.1 |
| 2020 | 2021 | 2022 | 2023 | |
| General government financial balance (% GDP) | -4.2 | -4.4 | -2.5 | -2.3 |
| Gross debt general government (% GDP) | 54.3 | 55.1 | 53.8 | 53.1 |
| Taxes and social security contributions (% GDP) | 39.7 | 39.5 | 38.6 | 39.1 |
| Gross government expenditure (% GDP) | 48.4 | 47.5 | 45.1 | 45.1 |
(a) The NOW wage cost subsidy, and the continuity contribution to health care, have an upward effect on the wage mutation in 2020 of 3.3%-points and a downward effect of 2.0%-points in 2021, 0.9%-points in 2022 and 0.3%-points in 2023.
Contacts


Contacts