
March 17, 2020
Forecast 17 March 2020 (CEP 2020 complete)
The economic impact of the coronavirus COVID-19 is highly uncertain. March 26, CPB publishes new corona-scenarios (in Dutch).

Downloads
")
Pdf, 2.5 MB
Fan Charts March 2020
The figures present fan charts around the CEP 2020 point forecasts for GDP growth, HICP inflation, unemployment and general government financial balance.
The solid line represents data realizations (2015-2019) and the CEP 2020 point forecasts for 2020 and 2021. Around the central path the figures present a fan of confidence intervals:
- 30% confidence interval from the 35th to 65th percentile, dark blue area
- 60% confidence interval from the 20th to 80th percentile, dark blue + blue area
- 90% confidence interval from the 5th to 95th percentile, dark blue + blue + light blue area
The probability is thus 30% that the outcome will fall in the dark blue area and the probability is 10% that the outcome will fall outside the fan. In other words, the fan is a graphical representation of the likelihood of the various outcomes. The solid line represents the most likely outcome and outcomes are more likely when they are closer to the solid line.
Downloads

Pdf, 188.7 KB
Contacts

March 17, 2020
Impact of coronavirus on Dutch economy highly uncertain.
Downloads

Pdf, 392.9 KB
Excel, 13.4 KB
Excel, 292.4 KB
Pdf, 297.5 KB
Excel, 13.4 KB
Table 'Main economic indicators', 2018-2021, March 2020
| 2018 | 2019 | 2020 | 2021 | |
| Relevant world trade volume goods and services (%) | 3.4 | 2.4 | 1.9 | 2.2 |
| Export price competitors (goods and services, non-commodities, %) | -0.6 | 2.1 | 1.2 | 1.2 |
| Crude oil price (dollar per barrel) | 70.9 | 64.3 | 62.4 | 58.4 |
| Exchange rate (dollar per euro) | 1.18 | 1.12 | 1.11 | 1.11 |
| Long-term interest rate the Netherlands (level in %) | 0.6 | -0.1 | 0.0 | 0.1 |
| 2018 | 2019 | 2020 | 2021 | |
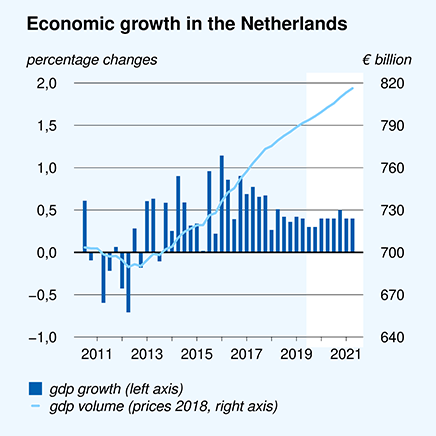
| Gross domestic product (GDP, economic growth, %) | 2.6 | 1.7 | 1.4 | 1.6 |
| Household consumption (%) | 2.3 | 1.4 | 1.9 | 1.9 |
| Government consumption (%) | 1.6 | 1.2 | 2.5 | 2.6 |
| Capital formation including changes in stock (%) | 2.2 | 4.6 | 0.4 | 1.5 |
| Exports of goods and services (%) | 3.7 | 2.6 | 2.7 | 2.8 |
| Imports of goods and services (%) | 3.3 | 3.2 | 3.3 | 3.4 |
| 2018 | 2019 | 2020 | 2021 | |
| Price gross domestic product (%) | 2.2 | 3.0 | 1.8 | 1.8 |
| Export price goods and services (non-energy, %) | 1.0 | 0.8 | 1.0 | 1.2 |
| Import price goods (%) | 2.7 | -1.2 | 0.3 | 0.3 |
| Inflation, harmonised index of consumer prices (HICP, %) | 1.6 | 2.7 | 1.6 | 1.6 |
| Compensation per hour private sector (%) | 1.8 | 3.0 | 3.2 | 3.4 |
| Wages as determined in collective labour agreements, private sector (%) | 2.0 | 2.4 | 2.9 | 2.8 |
| Purchasing power, static, median all households (%) | 0.1 | 1.0 | 2.1 | 1.3 |
| 2018 | 2019 | 2020 | 2021 | |
| Labour force (%) | 1.2 | 1.6 | 1.1 | 0.9 |
| Active labour force (%) | 2.3 | 2.0 | 1.3 | 0.8 |
| Unemployment (in thousands of persons) | 350 | 314 | 305 | 320 |
| Unemployed rate (% of the labour force) | 3.8 | 3.4 | 3.2 | 3.4 |
| Employment (hours, %) | 2.2 | 1.7 | 1.1 | 0.9 |
| 2018 | 2019 | 2020 | 2021 | |
| Labour share in enterprise income (level in %) | 73.1 | 73.9 | 75.1 | 75.9 |
| Labour productivity private sector (per hour, %) | 0.6 | 0.1 | 0.4 | 0.9 |
| Private savings (% of disposable household income) | 2.8 | 2.8 | 3.6 | 4.0 |
| Current-account balance (level in % GDP) | 11.2 | 9.6 | 9.7 | 9.1 |
| 2018 | 2019 | 2020 | 2021 | |
| General government financial balance (% GDP) | 1.5 | 1.7 | 1.1 | 0.1 |
| Gross debt general government (% GDP) | 52.4 | 48.8 | 46.3 | 45.2 |
| Taxes and social security contributions (% GDP) | 38.7 | 39.4 | 39.0 | 38.6 |
| Gross government expenditure (% GDP) | 42.5 | 42.1 | 42.4 | 42.9 |
Contacts

Contacts