
Forecast December 2018
CPB: Economy doing well, but past its peak

| Main data for the Dutch economy | 2018 | 2019 |
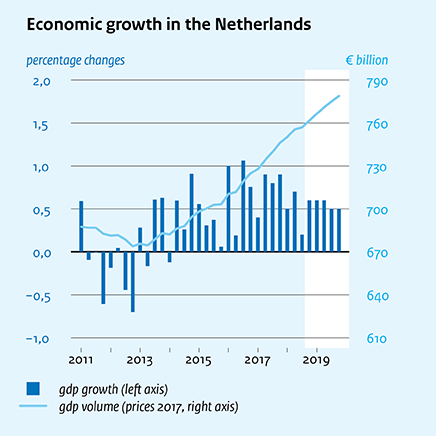
| Economic growth still considerable | 2,6 | 2,2 |
| Unemployment to its lowest level since 2001 | 3,9 | 3,6 |
| Indirect taxes pushing up inflation | 1,6 | 2,4 |
| Purchasing power increasing | 0,3 | 1,6 |
| Budget surpluses at historically high levels | 1,1 | 1,0 |
| Government debt decreases further | 52,4 | 48,9 |
Labour shortages will continue to increase, in 2019. Employment growth was strong in 2018, but will level off in 2019. After the sizeable decrease in unemployment to 3.9% in 2018, this will decrease to 3.6% in 2019. Labour shortages and higher inflation will cause rising increases in contract wages. Higher rents and increases in indirect taxes, in addition to wage cost increases, will contribute to the rising inflation. Next year will be the third consecutive year in which the government budget surplus will be at least 1.0% of GDP. However, in 2019, the budget balance, corrected for the economic circumstances, is projected to decline to a shortage of 0.2% of GDP.
This forecast is published in CPB Policy Brief 'Decemberraming 2018' (only in Dutch).
Downloads

Fan Charts December 2018
The figures present fan charts around the December 2018 point forecasts for GDP growth, HICP inflation, unemployment and general government financial balance.
The solid line represents data realizations (2013-2017) and the December 2018 point forecasts for 2018 and 2019. Around the central path the figures present a fan of confidence intervals:
- 30% confidence interval from the 35th to 65th percentile, dark blue area
- 60% confidence interval from the 20th to 80th percentile, dark blue + blue area
- 90% confidence interval from the 5th to 95th percentile, dark blue + blue + light blue area
The probability is thus 30% that the outcome will fall in the dark blue area and the probability is 10% that the outcome will fall outside the fan. In other words, the fan is a graphical representation of the likelihood of the various outcomes. The solid line represents the most likely outcome and outcomes are more likely when they are closer to the solid line.
Downloads

Contacts

Downloads

Table 'Main economic indicators', 2016-2019, 19 December 2019
| 2016 | 2017 | 2018 | 2019 | |
| Relevant world trade volume goods and services (%) | 3.7 | 5.0 | 3.2 | 3.5 |
| Export price competitors (goods and services, non-commodities, %) | -3.2 | 2.1 | 0.8 | 1.3 |
| Crude oil price (dollar per barrel) | 44.3 | 55.0 | 72.4 | 64.3 |
| Exchange rate (dollar per euro) | 1.11 | 1.13 | 1.18 | 1.14 |
| Long-term interest rate the Netherlands (level in %) | 0.3 | 0.5 | 0.6 | 0.6 |
| 2016 | 2017 | 2018 | 2019 | |
| Gross domestic product (GDP, economic growth, %) | 2.2 | 2.9 | 2.6 | 2.2 |
| Consumption households (%) | 1.1 | 1.9 | 2.7 | 1.9 |
| Consumption general government (%) | 1.3 | 1.1 | 1.2 | 3.4 |
| Capital formation including changes in stock (%) | -6.7 | 4.4 | 4.5 | 3.9 |
| Exports of goods and services (%) | 1.7 | 5.3 | 2.8 | 3.6 |
| Imports of goods and services (%) | -2.0 | 4.9 | 3.0 | 4.5 |
| 2016 | 2017 | 2018 | 2019 | |
| Price gross domestic product (%) | 0.5 | 1.2 | 2.3 | 2.3 |
| Export price goods and services (non-energy, %) | -1.4 | 1.9 | 0.8 | 1.2 |
| Import price goods (%) | -4.5 | 4.2 | 2.2 | -0.1 |
| Inflation, harmonised index of consumer prices (hicp, %) | 0.1 | 1.3 | 1.6 | 2.4 |
| Compensation per hour private sector (%) | 0.7 | 1.2 | 2.7 | 3.5 |
| Contractual wages private sector (%) | 1.5 | 1.6 | 2.0 | 2.8 |
| Purchasing power, static, median, all households (%) | 2.6 | 0.3 | 0.3 | 1.6 |
| 2016 | 2017 | 2018 | 2019 | |
| Labour force (%) | 0.4 | 0.8 | 1.1 | 1.2 |
| Active labour force (%) | 1.3 | 2.1 | 2.2 | 1.5 |
| Unemployment (in thousands of persons) | 538 | 438 | 350 | 335 |
| Unemployed rate (% of the labour force) | 6.0 | 4.9 | 3.9 | 3.6 |
| Employment (hours, %) | 2.0 | 1.9 | 2.3 | 1.5 |
| 2016 | 2017 | 2018 | 2019 | |
| Labour share in enterprise income (level in %) | 73.6 | 73.4 | 73.9 | 74.7 |
| Labour productivity private sector (per hour, %) | 0.2 | 0.9 | 0.3 | 0.7 |
| Private savings (% of disposable household income) | 3.6 | 2.9 | 2.8 | 2.7 |
| Current-account balance (level in % GDP) | 8.1 | 10.5 | 10.1 | 9.7 |
| 2016 | 2017 | 2018 | 2019 | |
| General government financial balance (% GDP) | 0.0 | 1.2 | 1.1 | 1.0 |
| Gross debt general government (% GDP) | 61.9 | 57.0 | 52.4 | 48.9 |
| Taxes and social security contributions (% GDP) | 38.4 | 38.7 | 38.7 | 39.2 |
| Gross government expenditure (% GDP) | 44.0 | 42.9 | 42.4 | 42.4 |