
Projections September 2020 (MEV 2021)
Extension of support package reduces increase in unemployment, but also leads to greater budget deficit

Pieter Hasekamp, CPB Director: ‘The support package has softened the blow and prevented a domino effect in the economy, but an increase in bankruptcies and unemployment is inevitable when companies have to adapt to changing demand. This means that the effectiveness of the support policy will gradually decrease. It is, therefore, wise to carefully phase out the support package and focus more on adaptation and retraining.’
| Baseline projections: | 2019 | 2020 | 2021 |
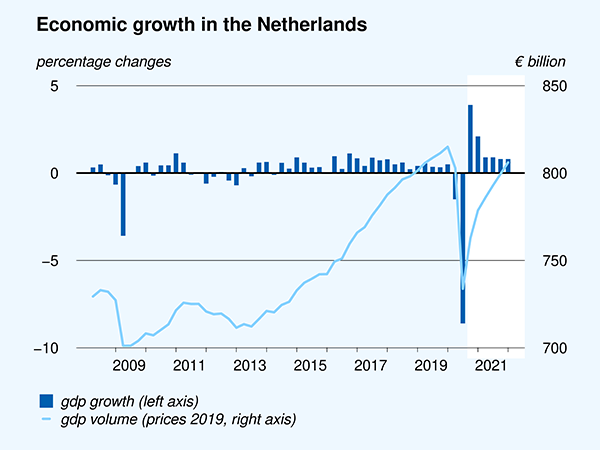
| Unprecedented decline in GDP, followed by partial recovery | 1.7 | -5.0 | 3.5 |
| Unemployment increases further in 2021 | 3.4 | 4.3 | 5.9 |
| Lower increase in static purchasing power next year | 1.0 | 2.2 | 0.8 |
| Large government budget deficit will continue into the next year (% GDP) | 1.7 | -7.6 | -5.1 |
| Debt ratio levels off at substantially higher level (% GDP) | 48.7 | 59.9 | 62.0 |
Development of the pandemic will decide the prospects of economic recovery. In order to do justice to this uncertainty, CPB also included a scenario with reimplementation of large-scale physical contact restrictions (i.e. ‘second-wave scenario’). Under such a scenario, the economy will shrink also in 2021 and unemployment will increase towards 10%.
In the baseline projections, the median static purchasing power will be slightly higher (+0.4%) in 2021 than in the provisional projections, as a result of additional reductions in the financial burden. These static purchasing power figures do not include the fact that lay-offs and turnover losses for the self-employed are causing significant income losses for large numbers of people and that the government has taken over part of the wage costs.
Public finances have been severely impacted, both by the support measures and lower tax revenues, but are not in jeopardy. Under the second-wave scenario, the debt ratio increases to 72% of GDP by the end of 2021, which is well below the European average and still below levels that are considered risky. Therefore, so far, there is no obvious reason for taking measures to reduce the deficit, not in the least because that could also further deepen the crisis.
Corona crisis hits weak spot
In the analysis in this MEV report, CPB draws attention to the effect of the corona crisis on inequality. On the labour market, the greatest impact is on vulnerable groups, including young people, the self-employed and migrants. Corona may also increase existing unequal opportunities in education and, thus, exacerbate income inequality in the long term. In the short term, government can support the groups that are most affected. The real challenge, however, is that of addressing the underlying vulnerabilities themselves, and relates to reducing the differences between permanent employment and flex work, combating ostensible self-employment and discrimination, reducing the differences in health levels and working conditions. Although this would come too late for the current crisis, it could ensure that society is more resilient by the time the next crisis hits.
Corona crisis dampens growth in productivity and labour supply
Today, in addition to the MEV, CPB also published an update of the medium-term outlook (MLT, only published in Dutch). In the baseline projections, the economy will gradually recover from the corona-related recession. Because of the high degree of uncertainty, a deep recession scenario was also calculated in which corona leads to greater long-term economic consequences. This scenario is in line with the second-wave scenario in the MEV that includes reimplementation of physical contact restrictions.
The corona outbreak will lead to a lower GDP level by 2025 than was projected in March. The 2025 GDP volume has been revised 4% downwards in the baseline projections, compared to those of March; under the deep recession scenario, it is as much as 9%. By 2025, unemployment will have gradually decreased to 4.5% in the baseline projections, and to over 6% under the deep recession scenario. Purchasing power will not increase, over the 2022–2025 period. The government deficit decreases to 1.7% of GDP by 2025 in the baseline projections, but will still be over 3% under the deep recession scenario. The corona outbreak worsens the sustainability gap; according to the current estimate for the baseline projections, the sustainability gap is 3.0% of GDP.
Downloads

Fan Charts September 2020
The figures present fan charts around the MEV 2021 point forecasts for GDP growth, HICP inflation, unemployment and general government financial balance.
The solid line represents data realizations (2015-2019) and the MEV 2021 point forecasts for 2020 and 2021. Around the central path the figures present a fan of confidence intervals:
- 30% confidence interval from the 35th to 65th percentile, dark blue area
- 60% confidence interval from the 20th to 80th percentile, dark blue + blue area
- 90% confidence interval from the 5th to 95th percentile, dark blue + blue + light blue area
The probability is thus 30% that the outcome will fall in the dark blue area and the probability is 10% that the outcome will fall outside the fan. In other words, the fan is a graphical representation of the likelihood of the various outcomes. The solid line represents the most likely outcome and outcomes are more likely when they are closer to the solid line.
Downloads

Contacts

Bij iedere budgettaire raming geeft het CPB een afzonderlijke inschatting van de onzekerheid. Tabellen 2.1 en 2.2 geven een overzicht van alle gecertificeerde maatregelen. In paragraaf 2 wordt de certificering van enkele specifieke ramingen toegelicht. Datzelfde geldt voor de certificering van de onzekerheidsanalyse.
Authors


De kredietcrisis, de Europese schuldencrisis en de recente uitbraak van het coronavirus laten zien dat de economie en overheidsfinanciën gevoelig zijn voor extreme schokken. Ook in de toekomst zullen nieuwe schokken zich voordoen. De schokproef is bedoeld om inzicht te krijgen in de schokbestendigheid van de overheidsfinanciën aan de hand van drie financieel-economische schokscenario’s: een financiële crisis, een Europese schuldencrisis en een mondiale economische crisis. Deze schokken zijn gesimuleerd in het nieuwe economische model CRASH - Chaos and Recession After a Shock. De uitkomsten van de schokproef laten zien dat de overheidsfinanciën in korte tijd hard geraakt kunnen worden. De schuldquote loopt in twee scenario’s op tot boven de 100% bbp in 2025. Financiële buffers in de overheidsfinanciën zijn nodig om de economische effecten na een schok (grotendeels) te mitigeren.
Authors
Voor de bekostiging van uitkeringen op grond van de Participatiewet ontvangen gemeenten een budget. De hoogte van het budget wordt bepaald op basis van een raming voor het aantal uitkeringsgerechtigden en de gemiddelde hoogte van een uitkering. Het CPB publiceert ramingen van het aantal bijstandsuitkeringen in het lopende en komende jaar in het Centraal Economisch Plan (CEP) in maart en in de Macro Economische Verkenning (MEV) in september. Het uitgangspunt in de raming is de ramingsregel die het verband weergeeft tussen mutaties in de werkloze beroepsbevolking (WBB) en de mutatie in de bijstand.
Authors

Tot Prinsjesdag 2020 hanteerden beiden organisaties een verschillende definitie voor de beleidsmatige lastenontwikkeling. Dit kon onder andere leiden tot situaties waarin het CPB van een beleidsmatige lastenstijging sprak, terwijl het kabinet een lastenverlichting zag of vice versa. Dit achtergronddocument is in samenwerking met het ministerie geschreven. Het beschrijft onder meer hoe de nieuwe definitie werkt.
Externe auteur: Martijn Badir (Ministerie van Financiën)
Authors

We simulate combinations of shocks in world trade, equity prices, housing prices, and the interest rates on bonds and bank loans to represent a financial crisis scenario. In addition, we study the role of initial conditions. In particular, we explore to what extent a substantially different leverage ratio of banks, funding ratio of pension funds and loan-to-value ratio of households changes the impact of extreme external shocks.
Downloads

Authors


Het CPB en PBL geven daarnaast aan dat een algemene investeringssubsidie niet per definitie zinvol is. Ook bijvoorbeeld een btw-verlaging zet geen zoden aan de dijk als er een vraagtekort is in de bouw. Specifieke subsidies, bijvoorbeeld gericht op bepaalde regio’s, kunnen wel nuttig zijn. Ook constateren de kennisinstituten dat het crisisbeleid en structuurbeleid (dat over meerdere jaren gaat) niet altijd makkelijk te verenigen zijn.
Externe auteurs: Edwin Buitelaar (PBL), Frans Schilder (PBL)
Authors

Downloads

Table 'Main economic indicators', 2018-2021, September 2020
| 2018 | 2019 | 2020 | 2021 | |
| Relevant world trade volume goods and services (%) | 3.3 | 3.3 | -9.3 | 6.8 |
| Export price competitors (goods and services, non-commodities, %) | -0.8 | 3.0 | 0.2 | 0.0 |
| Crude oil price (dollar per barrel) | 70.9 | 64.3 | 41.7 | 45.1 |
| Exchange rate (dollar per euro) | 1.18 | 1.12 | 1.12 | 1.14 |
| Long-term interest rate the Netherlands (level in %) | 0.6 | -0.1 | -0.3 | -0.3 |
| 2018 | 2019 | 2020 | 2021 | |
| Gross domestic product (GDP, economic growth, %) | 2.4 | 1.7 | -5.0 | 3.5 |
| Household consumption (%) | 2.2 | 1.5 | -5.8 | 4.4 |
| Government consumption (%) | 1.7 | 1.6 | 3.9 | 1.9 |
| Capital formation including changes in stock (%) | 3.9 | 3.6 | -8.2 | 6.9 |
| Exports of goods and services (%) | 4.3 | 2.7 | -5.2 | 4.7 |
| Imports of goods and services (%) | 4.7 | 3.2 | -3.6 | 5.8 |
| 2018 | 2019 | 2020 | 2021 | |
| Price gross domestic product (%) | 2.4 | 3.0 | 1.7 | 1.5 |
| Export price goods and services (non-energy, %) | 0.9 | 1.0 | 0.6 | 1.1 |
| Import price goods (%) | 2.2 | -1.1 | -3.9 | 0.9 |
| Inflation, harmonised index of consumer prices (HICP, %) | 1.6 | 2.7 | 1.4 | 1.4 |
| Compensation per hour private sector (%) (a) | 1.9 | 2.4 | 4.0 | 0.3 |
| Wages as determined in collective labour agreements, private sector (%) | 2.0 | 2.4 | 2.5 | 1.4 |
| Purchasing power, static, median all households (%) | 0.0 | 1.0 | 2.2 | 0.8 |
| 2018 | 2019 | 2020 | 2021 | |
| Labour force (%) | 1.2 | 1.6 | -0.1 | 0.6 |
| Active labour force (%) | 2.3 | 2.0 | -1.0 | -1.0 |
| Unemployment (in thousands of persons) | 350 | 314 | 395 | 545 |
| Unemployed rate (% of the labour force) | 3.8 | 3.4 | 4.3 | 5.9 |
| Employment (hours, %) | 2.6 | 2.2 | -3.6 | 1.2 |
| 2018 | 2019 | 2020 | 2021 | |
| Labour share in enterprise income (level in %) | 73.4 | 74.0 | 73.0 | 74.0 |
| Labour productivity private sector (per hour, %) | -0.1 | -0.5 | -1.4 | 2.8 |
| Private savings (% of disposable household income) | 3.2 | 3.1 | 9.2 | 7.1 |
| Current-account balance (level in % GDP) | 10.8 | 9.9 | 8.3 | 7.6 |
| 2018 | 2019 | 2020 | 2021 | |
| General government financial balance (% GDP) | 1.4 | 1.7 | -7.6 | -5.1 |
| Gross debt general government (% GDP) | 52.4 | 48.7 | 59.9 | 62.0 |
| Taxes and social security contributions (% GDP) | 38.8 | 39.3 | 38.0 | 38.7 |
| Gross government expenditure (% GDP) | 42.8 | 42.4 | 50.3 | 48.3 |
(a) The NOW wage cost subsidy, and the continuity contribution to health care, have an upward effect on the wage mutation in 2020 of 2.0%-points and a downward effect of 1.5%-points in 2021.
Contacts

Contacts