
Projections September 2021 (MEV 2022)
Strong recovery of the Dutch economy, but coronavirus-related uncertainty remains

The spread of the coronavirus remains a source of uncertainty, which determines the pace of recovery. Under a scenario in which a new lockdown is necessary, GDP growth would be about 2 percentage points cumulatively lower in 2021 and 2022. Partly because government support is assumed to be provided again under such a scenario, the rise in unemployment would be limited, up to 3.6% in 2022.
The economic growth figures in CPB’s baseline projections are slightly higher than those in the draft projections published in August. The difference is due to the decisions in the Budget Memorandum, including the additional spending on health care and security, which have been incorporated into the current projections. As a result, the government deficit in 2022 will be approximately EUR 4 billion higher, at -2.3% of GDP.
CPB’s Director, Pieter Hasekamp: ‘A year and a half has passed since the coronavirus pandemic started, and now it is clear that the worst-case economic scenarios did not come to pass. The Dutch economy proved to be very resilient. The financial support policy has played a major role in how well the labour market has weathered the crisis. Although a few sectors will continue to suffer the negative consequences of the coronavirus for a longer period, the labour shortages that existed before the outbreak of the crisis have already returned in many sectors.’
| Baseline projections: | 2020 | 2021 | 2022 |
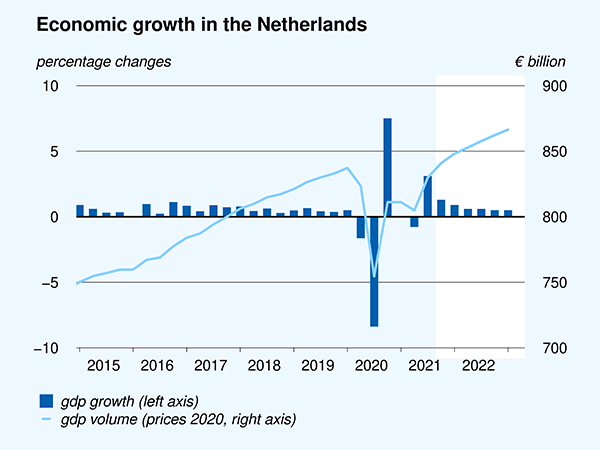
| Strong recovery under the baseline projections (GDP growth, %) | -3.8 | 3.9 | 3.5 |
| Unemployment hardly increases after end to support measures (%) | 3.8 | 3.4 | 3.5 |
| Static purchasing power limited due to lower real wage growth (%) | 2.5 | 0.8 | 0.1 |
| Government deficit decreases after end to support measures (GDP, %) | -4.2 | -5.4 | -2.3 |
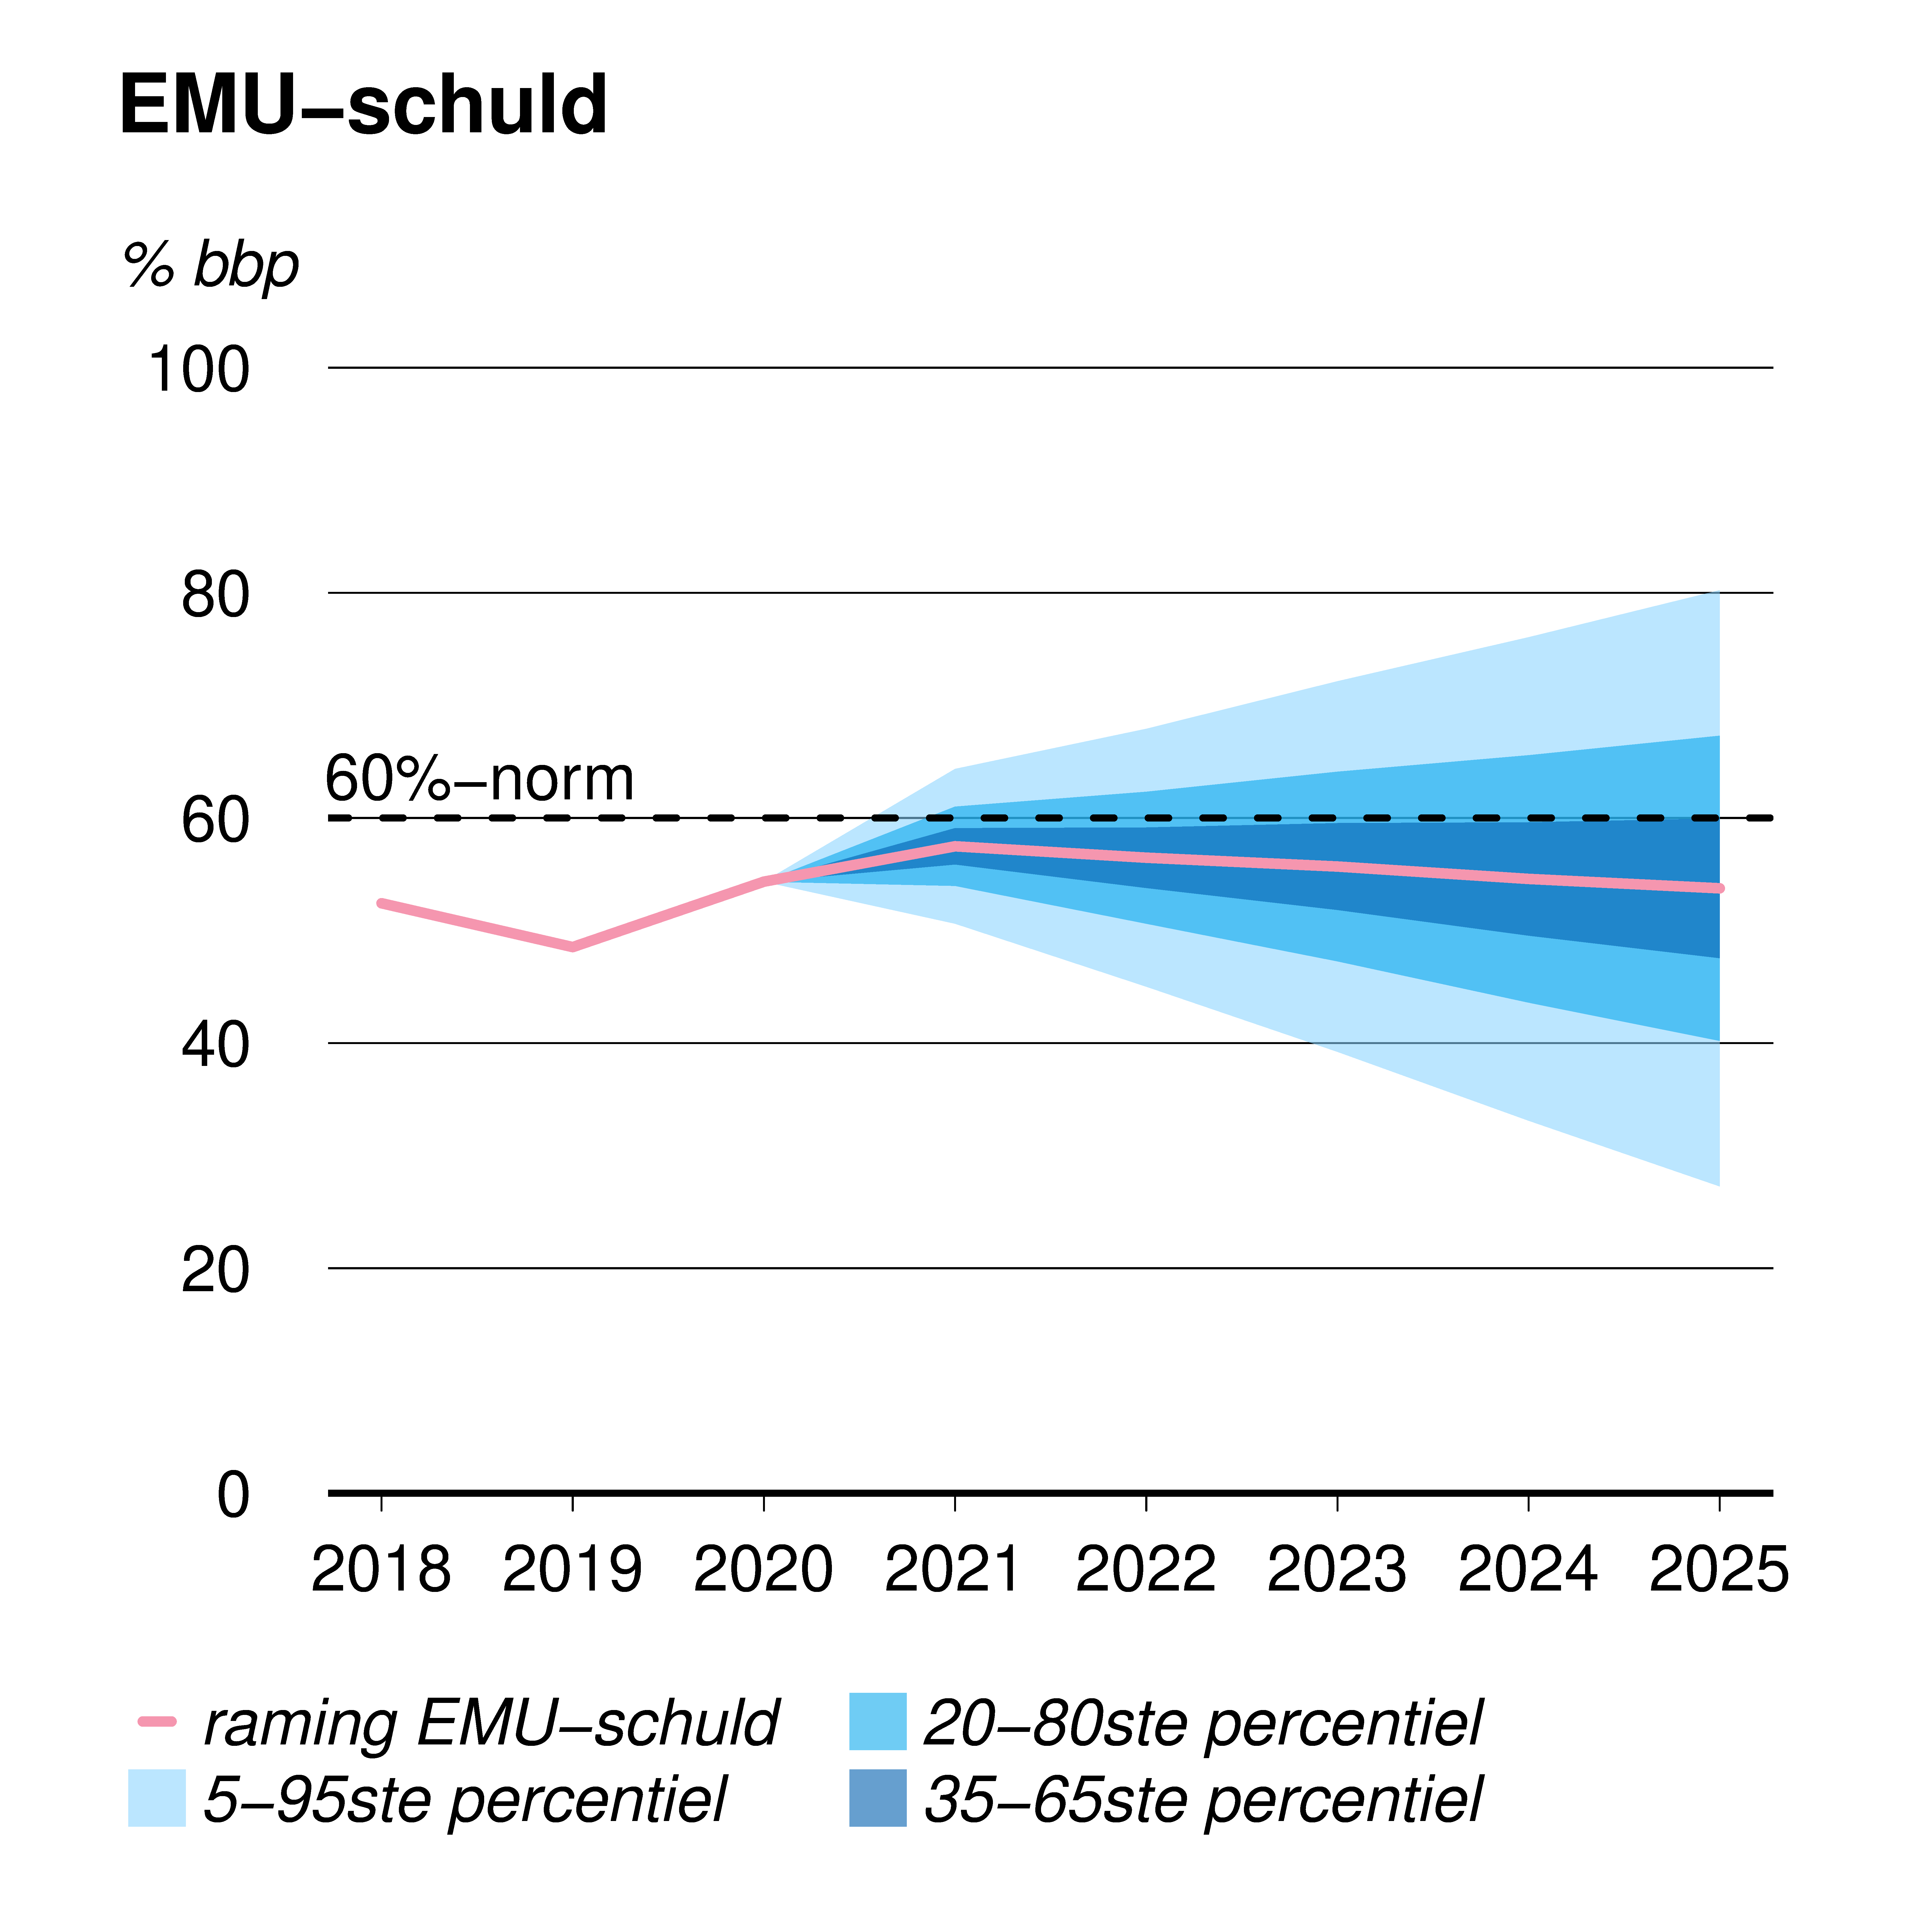
| Government debt decreases due to denominator effect (GDP, %) | 54.3 | 57.5 | 56.5 |
Government debt below EU limit value
Government finances have absorbed a large part of the economic blow. And they could; despite the high budget deficits of 2020 and 2021, the government debt has remained below the European limit value of 60% of GDP. Because of the strong economic recovery, next year, the debt level expressed as a percentage of GDP, will decrease again, according to the baseline projections. Under the scenario of a new lockdown, the debt ratio will continue to increase slightly in 2022 — but even under this scenario, spending cuts will not be necessary. This does not alter the fact that it would be wise to return to the budgetary rules that were abandoned during the crisis. Budgetary rules ensure that policy objectives are considered in an integral manner and tax revenues are spent efficiently.
The MEV also includes an update of CPB’s medium-term outlook (MLT) which CPB will use for possibly analysing the next Coalition Agreement. The MLT shows that, under unchanged policy, the budget deficit will gradually decrease to around -1% of GDP, over the period through to 2025. The debt ratio will decrease to close on 54% of GDP.
Attention for long-term challenges
Because of the strong economic recovery, there is no need for extensive recovery policy. The government can, however, promote economic development by offering more security for a number of urgent long-term challenges, such as climate and energy, physical environment, inequality regarding education and on the labour market, and the affordability and organisation of health care. Additional public investments are often advocated, but other policy instruments, such as changes in regulation and taxation, are also important. In the short term, given the shortages on the labour market, large-scale investments are difficult to realise and would possibly have a price-increasing effect.
In the analysis that is published together with to this MEV, CPB states that the recent surge in consumer price inflation in Europe and the United States is probably temporary. However, the longer term trend of rising prices of owner-occupied housing and other capital assets is a cause for concern, as it leads to growing wealth inequality and puts financial stability at risk. The increase is partly the result of monetary policy, but there are also domestic policy options in the way of spatial planning and taxation to counteract problematic house price increases.
Questions and answers
Why is unemployment rising slightly again in 2022, despite the strong economic recovery?
Unemployment is expected to increase, slightly, due to a strong increase in labour supply as well as to workers starting to work more hours. The latter is partly due to the end of the package of support measures. It may also cause some companies to run into difficulties.
Downloads

.
Contacts

Fan Charts September 2021
The figures present fan charts around the MEV 2022 point forecasts for GDP growth, HICP inflation, unemployment and general government financial balance.
The solid line represents data realizations (2016-2020) and the MEV 2022 point forecasts for 2021 and 2022. Around the central path the figures present a fan of confidence intervals:
- 30% confidence interval from the 35th to 65th percentile, dark blue area
- 60% confidence interval from the 20th to 80th percentile, dark blue + blue area
- 90% confidence interval from the 5th to 95th percentile, dark blue + blue + light blue area
The probability is thus 30% that the outcome will fall in the dark blue area and the probability is 10% that the outcome will fall outside the fan. In other words, the fan is a graphical representation of the likelihood of the various outcomes. The solid line represents the most likely outcome and outcomes are more likely when they are closer to the solid line.
Downloads

Contacts


Maatregelen met een geraamd budgettair effect van meer dan 50 mln euro en maatregelen met grote gedragseffecten of een sterk onzekere grondslag hebben een uitvoerige beoordeling gekregen.
Authors


Het achtergronddocument gaat in op de trefzekerheid in verschillende deelperiodes. De raming van de bbp-ontwikkeling wordt, net als de volumeontwikkeling van de particuliere consumptie, de uitvoer en de investeringen van bedrijven, afgezet tegen de realisatiecijfers. Daarnaast besteden we aandacht aan de trefzekerheid van andere economische grootheden, zoals de consumentenprijsindex (cpi), de werkloosheidsvoet en het EMU-saldo.
Een grote bron van onzekerheid rondom de CPB-ramingen zit in de aannames omtrent de ontwikkeling van exogene factoren, zoals het internationale beeld. Daarnaast zorgen nieuwe beleidsvoornemens per definitie voor een ramingsafwijking, en vormen bijstellingen in de CBS-cijfers een bron van ramingsonzekerheid.
Authors

De schuldprojectie is net als het houdbaarheidssaldo een indicator voor de financiële lasten voor toekomstige generaties. Naast de gevoeligheidsanalyses gaat het achtergronddocument in op de betekenis van en de aannames onderliggend aan deze indicatoren.
Een deel van de gevoeligheidsvarianten is opgenomen op verzoek van het ministerie van Financiën voor verwerking in de Miljoenennota 2022.
Authors


Ramingsverschillen komen doordat de economie onzeker is, maar kunnen ook veroorzaakt zijn door ten tijde van de raming nog onbekende beleidswijzigingen, bijstellingen in de nationale rekeningencijfers van het CBS en misspecificatie in het voorspelmodel. Het resulterende verschil is dus niet noodzakelijkerwijs altijd een ramingsfout.
Authors
Voor de bekostiging van uitkeringen op grond van de Participatiewet ontvangen gemeenten een budget. De hoogte van het budget wordt bepaald op basis van een raming voor het aantal uitkeringsgerechtigden en de gemiddelde hoogte van een uitkering. Het CPB publiceert ramingen van het aantal bijstandsuitkeringen in het lopende en komende jaar in het Centraal Economisch Plan (CEP) in maart en in de Macro Economische Verkenning (MEV) in september. Het uitgangspunt in de raming is de ramingsregel die het verband weergeeft tussen mutaties in de werkloze beroepsbevolking en de mutatie in de bijstand.
Authors

Authors

Downloads

Table 'Main economic indicators', 2019-2022, September 2021
| 2019 | 2020 | 2021 | 2022 | |
| Relevant world trade volume goods and services (%) | 3.1 | -9.3 | 6.6 | 6.6 |
| Export price competitors (goods and services, non-commodities, %) | 3.9 | 0.3 | 3.6 | 1.5 |
| Crude oil price (dollar per barrel) | 64.3 | 41.8 | 69.5 | 69.4 |
| Exchange rate (dollar per euro) | 1.12 | 1.14 | 1.19 | 1.18 |
| Long-term interest rate the Netherlands (level in %) | -0.1 | -0.4 | -0.3 | -0.3 |
| 2019 | 2020 | 2021 | 2022 | |
| Gross domestic product (GDP, economic growth, %) | 2.0 | -3.8 | 3.9 | 3.5 |
| Household consumption (%) | 0.9 | -6.6 | 2.4 | 5.8 |
| Government consumption (%) | 2.8 | 1.0 | 6.0 | 1.5 |
| Capital formation including changes in stock (%) | 7.7 | -5.4 | 1.7 | 3.6 |
| Exports of goods and services (%) | 2.0 | -4.8 | 6.8 | 5.4 |
| Imports of goods and services (%) | 3.2 | -5.5 | 6.5 | 6.4 |
| 2019 | 2020 | 2021 | 2022 | |
| Price gross domestic product (%) | 3.0 | 2.3 | 2.3 | 1.8 |
| Export price goods and services (non-energy, %) | 1.0 | -0.4 | 4.2 | 1.3 |
| Import price goods (%) | -1.1 | -5.1 | 8.3 | 1.2 |
| Inflation, harmonised index of consumer prices (HICP, %) | 2.7 | 1.1 | 1.9 | 1.8 |
| Compensation per hour private sector (%) (a) | 2.6 | 7.6 | -0.4 | 1.1 |
| Wages as determined in collective labour agreements, private sector (%) | 2.4 | 2.8 | 2.0 | 2.2 |
| Purchasing power, static, median all households (%) | 1.1 | 2.5 | 0.8 | 0.1 |
| 2019 | 2020 | 2021 | 2022 | |
| Labour force (%) | 1.6 | 0.4 | 0.3 | 1.2 |
| Active labour force (%) | 2.0 | 0.0 | 0.8 | 1.1 |
| Unemployment (in thousands of persons) | 314 | 357 | 315 | 330 |
| Unemployed rate (% of the labour force) | 3.4 | 3.8 | 3.4 | 3.5 |
| Employment (hours, %) | 2.1 | -2.7 | 2.3 | 1.8 |
| 2019 | 2020 | 2021 | 2022 | |
| Labour share in enterprise income (level in %) | 73.9 | 74.9 | 73.3 | 73.9 |
| Labour productivity private sector (per hour, %) | 0.0 | -1.2 | 1.5 | 1.6 |
| Private savings (% of disposable household income) | 4.5 | 11.6 | 11.4 | 6.8 |
| Current-account balance (level in % GDP) | 9.4 | 7.0 | 8.2 | 8.9 |
| 2019 | 2020 | 2021 | 2022 | |
| General government financial balance (% GDP) | 1.7 | -4.2 | -5.4 | -2.3 |
| Gross debt general government (% GDP) | 48.5 | 54.3 | 57.5 | 56.5 |
| Taxes and social security contributions (% GDP) | 39.3 | 39.7 | 38.8 | 38.3 |
| Gross government expenditure (% GDP) | 42.4 | 48.4 | 48.1 | 44.5 |
(a) The NOW wage cost subsidy, and the continuity contribution to health care, have an upward effect on the wage mutation in 2020 of 3.3%-points and a downward effect of 1.6%-points in 2021 and 1.5%-points in 2022.
Contacts

Contacts